
- The NZD/USD pair continues its decline for the fourth consecutive day, with a clear breach of key support levels, influenced by the strength of the US dollar following the release of positive economic data in April.
- Selling momentum is gaining momentum amid the absence of strong economic stimulus from New Zealand.
NZD/USD Technical analysis Today: Technical Overview:
- The pair is trading below the resistance level of 0.5927 – 0.5945
- The short-term trend is clearly bearish
- A break below 0.5910 is under test
- Any break below 0.5910 threatens a broader decline to 0.5885
Today’s NZD/USD Analysis: Technical Indicators
- Moving Averages (EMA):
- The price is below the 50-, 100-, and 200-period averages
- All are sloping down, forming ongoing dynamic resistance
- MACD:
- In the negative zone
- Selling momentum is strong with a widening gap between the two indicator lines
- Stochastic:
- In the oversold zone (<20)
- A slight rebound may occur, but it is uncertain
Expected Scenarios:
Bullish Scenario (Weak Corrective):
- In the event of a return above 0.5927, we may witness a temporary rise to:
- 0.5940
- 0.5950
Bearish scenario (likely):
- Continued trading below 0.5927 could push the pair to:
- 0.5910
- 0.5885
Scenario points do not exceed 10 pips up and down, as requested.
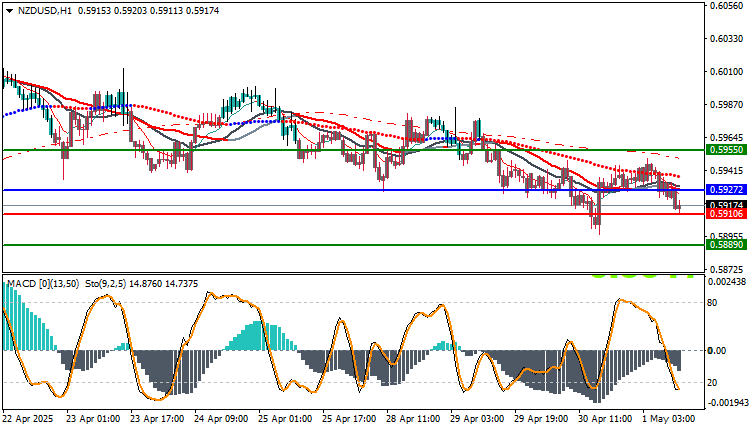
Trading strategies based on Buy/Sell levels
| NZDUSD | In case of buying | in case of selling |
| Entry point | 0.59272 | 0.59106 |
| Target Point 1 (TP1) | First resistance: 0.59550 | First support: 0.58890 |
| Target Point 2 (TP2) | Second resistance: 0.59850 | Second support: 0.58590 |
| Stop Loss (SL) | 0.59106 | 0.59272 |
The NZD/USD pair is moving within a clear downward channel. With the lack of buying momentum and weak New Zealand data, the pair is likely to continue to be pressured towards 0.5910 and then 0.5885.
Any current rise is considered a correction unless there is a clear break above 0.5950.
Impactful Economic Data This Week:
May 2: US Unemployment Claims
May 3: Nonfarm Payrolls (NFP) Report
US Unemployment Rate


