
The Nasdaq 100 is moving sideways today, currently trading at $19836. While the index is above most of the moving average crossovers, there are signs of weakness in the trend, which calls for a careful analysis of the index’s near-term future.
Nasdaq 100: Technical Outlook
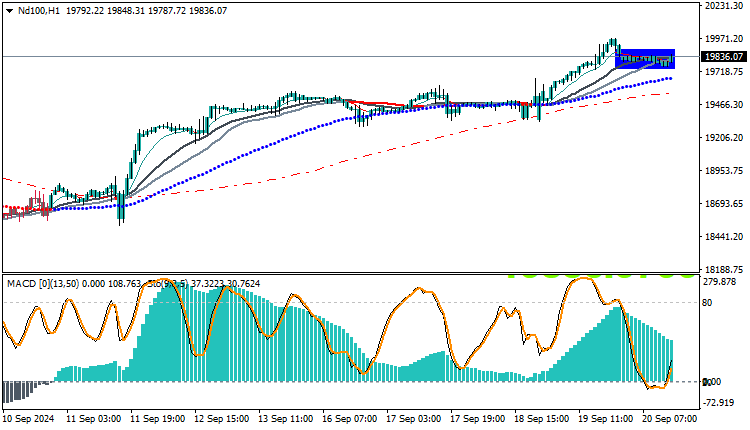
On the hourly chart, it is clear that the Nasdaq 100 is forming a sideways range between support and resistance levels. The index is currently trading above averages such as the 50 and 100 days, which provides some support, but it is still unable to break out to higher levels sustainably.
The MACD indicator is showing weak buying power, as the two lines are converging, indicating that positive momentum may be fading. This signal suggests that buyers may have difficulty pushing prices higher, which increases the likelihood of the sideways trend continuing for a longer period.
Indicators Forecast
MACD: Indicates weak buying momentum, which increases the possibility of price instability in the near future.
Relative Strength Index (RSI): Trading near the 50 level, reflecting a state of stability, with the possibility of volatility.
Moving Average Indicators: Support the sideways trend, but may need more momentum to rebuild the upward trend.
Trading strategies levels on Buy/Sell level
| ND100 | In case of buying | in case of selling |
| Entry point | 19866 | 19744 |
| Target Point 1 (TP1) | First resistance: 19900 | First support: 19622 |
| Target Point 2 (TP2) | Second resistance: 19970 | Second support: 19510 |
| Stop Loss (SL) | 19744 | 19866 |
Current Technical Analysis, the Nasdaq 100 index appears in a state of sideways trend with weak buying momentum. If this pattern continues, the index may remain confined between the $19800 and $20000 levels. The support level at $19800 should be watched, as it could be a rebound point in case the index faces downward pressure.


