
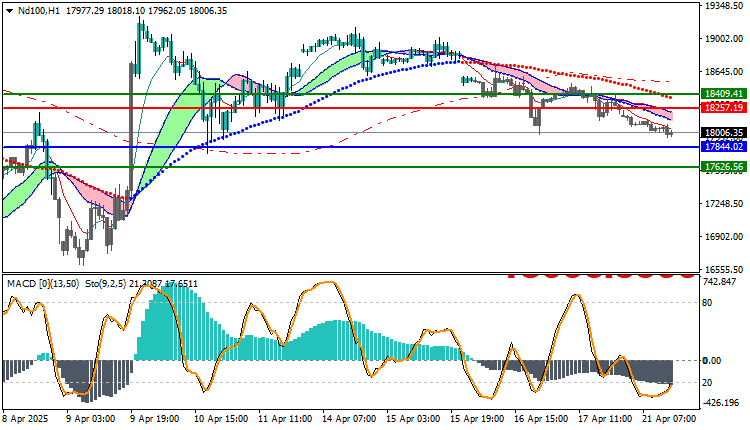
The Nasdaq 100 has been on a steady decline since mid-April, amid selling pressure stemming from a decline in risk appetite in the US stock market and growing concerns about the earnings results of major technology companies. The H1 chart shows a clear downtrend, with the price approaching key support areas.
Current Price and Quick Overview
- Current Price: 18,006 points
- General Trend: Short-term bearish
- Last Support Broken: 18,150
- Nearest Current Support: 17,844, then 17,626
Continued Decline After Failure to Hold Above 18,400
A Clear Break of Moving Averages
Negative Indicators Support Continued Pressure
Nasdaq 100 Technical Analysis
General Trend:
The index is moving in a short-term descending channel after a mid-April bullish wave, failing to maintain positive momentum and breaching several key support levels.
Technical Indicators:
- MACD: Remains in negative territory, with the histogram remaining below the zero line.
- Stochastic Oscillator: Attempting to rebound from the oversold zone, which may indicate a short-term upward correction.
- Moving Averages: The price is below all moving averages (20, 50, 200), reinforcing the negative outlook.
Technical Outlook for Today’s Session
Probable Scenario:
Continued decline toward support at 17,844. If broken, the next target will be 17,626.
Alternative Scenario:
In the event of a rebound from current levels, resistance at 18,257 will be the first barrier to any potential recovery.
Trading strategies levels on Buy/Sell level
| ND100 | In case of buying | in case of selling |
| Entry point | 18257.19 | 17844.02 |
| Target Point 1 (TP1) | First resistance: 18409.41 | First support: 17626.56 |
| Target Point 2 (TP2) | Second resistance: 18605.55 | Second support: 17241.55 |
| Stop Loss (SL) | 17844.02 | 18257.19 |
The Nasdaq 100 (ND100) remains under clear selling pressure in the short term, particularly with the failure to hold above 18,400. Technical indicators support a bearish scenario, but a temporary correction is not ruled out if nearby support areas hold.


