
After a series of consecutive losses, the Nasdaq 100 has begun to show signs of stabilization and a technical rebound. It is currently trading above the 18,000 level, attempting to surpass key technical resistance levels. Given the growing short-term upward momentum, investors are awaiting a new confirmation signal to determine whether this is the beginning of a reversal or merely a rebound within a downtrend.
Price Overview
- Current Price: 18,013.56
- Near-term trend: Upward rebound
- General trend (since April 15): Down
- Nearest resistance: 18,200
- Key support: 17,700
The index has returned to trading above the 18,000 line after a clear rebound from the 17,700 low, and is now testing an important resistance area at 18,200. A break above this level would open the way for a new upward wave.
Technical Analysis
Technical Indicators:
- MACD: A clear positive signal, with a tendency to break the zero line, supports the upward momentum.
- Stochastic: It has exited the overbought zone, but it still gives a general positive signal that supports the continuation of the uptrend in the near term.
Today’s Trading Forecast and Scenarios
Positive Scenario (Breakthrough and Continuation):
- A steady break above the 18,200 level could push the index to test the next resistance at 18,328, which, if exceeded, could open the way towards 18,500.
Negative Scenario (Failure to Rebound):
- If the price fails to maintain trading above 18,000 and breaks the 17,874 level, the sell scenario will prevail, with the initial target at 17,700 and then 17,500.
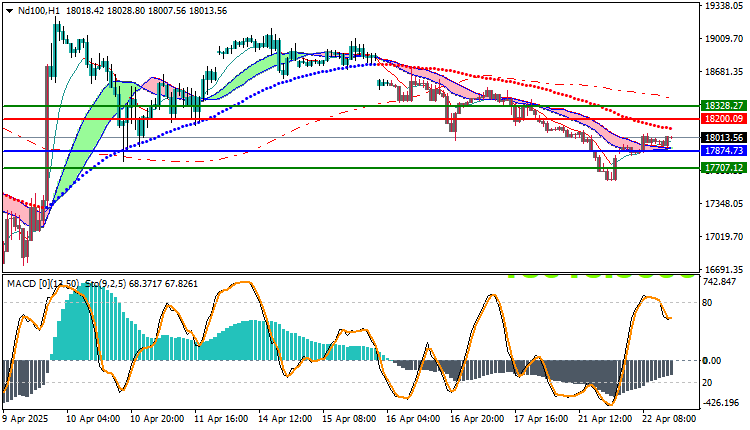
Trading strategies levels on Buy/Sell level
| ND100 | In case of buying | in case of selling |
| Entry point | 18200.09 | 17874.73 |
| Target Point 1 (TP1) | First resistance: 18328.27 | First support: 17707.12 |
| Target Point 2 (TP2) | Second resistance: 18641.54 | Second support: 17501.74 |
| Stop Loss (SL) | 17874.73 | 18200.09 |
The Nasdaq is showing initial signs of a technical recovery, supported by improving short-term technical indicators. However, a break above the 18,200 resistance level remains necessary to confirm an upward reversal. With influential economic data and earnings results from tech giants awaited, this week’s sessions will be crucial for the index’s trajectory.


