
The Nasdaq 100 is currently trading in an uptrend, but there are some signs of weakness confirmed by technical indicators. The index is currently trading at $19,420, and is trading above the moving average crossovers, which shows the continuation of the upward trend, but accompanied by some challenges.
Moving Average Signals and Trend Continuation
The Nasdaq 100 is showing stable trading above the moving average crossovers, which enhances the possibility of the continuation of the upward trend. This means that the market is still maintaining its momentum, despite some fluctuations that may appear in the price action.
Weak Momentum in the MACD Indicator
The MACD Indicator indicates a weakness in the upward momentum, which raises questions about the index’s ability to continue rising with the same strength. This weakness may herald the possibility of some corrections or pullbacks in the near term.
Nasdaq 100 Future Outlook
Based on current indicators, the Nasdaq 100 is expected to continue its upward trend, but with signs of weakness that may lead to price fluctuations or minor corrections. Traders should carefully monitor technical indicators to ensure that they make sound investment decisions.
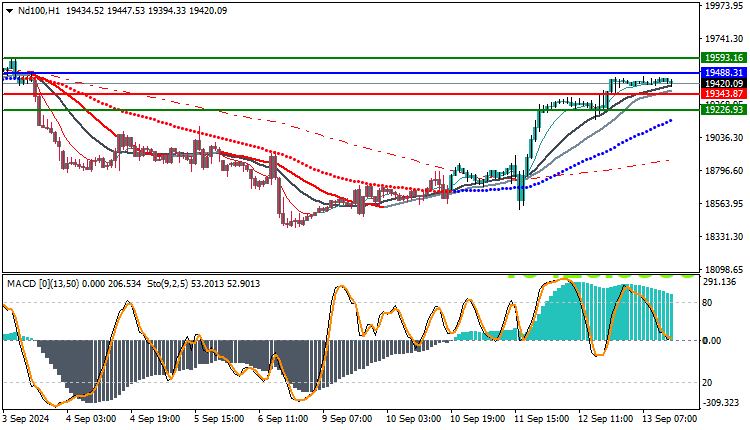
Trading strategies levels on Buy/Sell level
| ND100 | In case of buying | in case of selling |
| Entry point | 19488 | 19343 |
| Target Point 1 (TP1) | First resistance: 19593 | First support: 19226 |
| Target Point 2 (TP2) | Second resistance: 19700 | Second support: 19120 |
| Stop Loss (SL) | 19343 | 19488 |
With the Nasdaq 100 in an uptrend, signs of weakness from technical indicators, such as the MACD, remain a point to consider. Although the price has stabilized above the moving average crossovers, the possibility of price fluctuations or corrections exists. Traders are advised to closely monitor technical indicators and make cautious decisions, taking into account any potential changes in market momentum.


