
NAS100 NDX Technical Analysis: The Nasdaq Index is currently trading in a weak uptrend as the index recorded its highest trading price for the day at 21728.14 points, while it recorded its lowest price at 21627.27 points. Currently, the index is trading at 21666.01 points.
NAS100 NDX Technical Analysis: Technical Analysis
By observing the price action, it appears that the index is trading at the beginning of a sideways trend, as it is difficult to determine a clear direction in the short term. Prices are also indicating a slight decline as they are currently trading below the moving averages, which supports the hypothesis of a possible downtrend if the selling pressure continues. On the other hand, the MACD indicator is reflecting weak positive signals, indicating some upward momentum, but it remains not strong enough to support the continuation of the uptrend at the moment.
Future Outlook:
Given the current situation, the market appears to be in a volatility phase as the index maintains weak gains in a sideways range. If trading continues below the moving averages, we may see a downward reversal in case of further selling pressure. On the other hand, if the index manages to break above nearby resistance levels, the upward momentum may gradually resume.
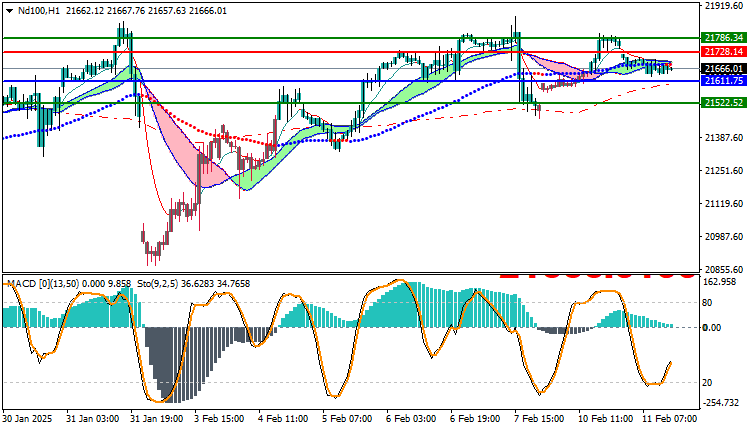
Trading strategies levels on Buy/Sell level
| ND100 | In case of buying | in case of selling |
| Entry point | 21728.14 | 21611.75 |
| Target Point 1 (TP1) | First resistance: 21786.34 | First support: 21522.52 |
| Target Point 2 (TP2) | Second resistance: 21850.00 | Second support: 21470.25 |
| Stop Loss (SL) | 21611.75 | 21728.14 |
Looking at the technical data, the sideways trend is currently prevailing with bullish and bearish signals. The indicator needs to break resistance levels or support positive momentum to continue the uptrend stronger. Technical indicators should be closely monitored, especially as there are signals supporting the possibility of sideways movements in the near future.


