
NAS100 NDX Technical Analysis: The Nasdaq is currently trading in an upward trend, but this trend is showing significant weakness. The index recorded its highest price today at $19,315, and the lowest price at $19,155, while it is currently trading at $19,231. Although the overall trend is still upward, there are signs of a slight decline, which may affect the strength of the trend.
NAS100 NDX Technical Analysis:Technical Analysis
- General Trend:
Upward trend: The index is showing an upward trend, but the relative strength of this trend has begun to decline. Prices have not fallen sharply, but weakness is evident in recent movements.
- Technical Indicators:
Moving Averages: Prices are currently trading above the moving averages, indicating potential support that will push prices to continue the upward trend. However, this support may not be sufficient if the current weakness continues.
MACD Indicator: The MACD Indicator is showing weakness in the positive direction, indicating a decline in buying power. This weakness may contribute to an increased probability of a downward correction in the short term.
Nasdaq ND100 Technical Analysis: Trading Strategy for Today
- Buying opportunities: Buying opportunities may be considered if prices show a recovery above the moving averages and regain upward momentum. It is advisable to set entry points near the current support levels ($19,155), with stop-loss orders placed below these levels to protect against large pullbacks.
- Selling opportunities: If the MACD indicator continues to show weakness in the positive direction and prices start to break the support levels, there may be an opportunity to sell. It is preferable to set entry points near the previous resistance levels, with stop-loss orders placed above these levels to reduce the risk.
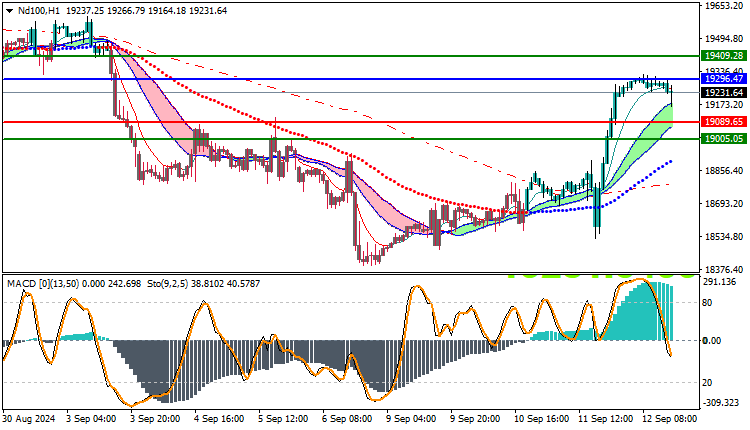
Trading strategies levels on Buy/Sell level
| ND100 | In case of buying | in case of selling |
| Entry point | 19296 | 19089 |
| Target Point 1 (TP1) | First resistance: 19409 | First support: 19005 |
| Target Point 2 (TP2) | Second resistance: 19506 | Second support: 18950 |
| Stop Loss (SL) | 19089 | 19296 |
Nasdaq analysis suggests that the overall trend is still bullish, but there are signs of weakness in the short term. Trading above the moving averages reinforces the positive outlook, but weakness in the MACD indicator calls for caution. It is advisable to closely monitor the markets and use flexible trading strategies to ensure that opportunities are exploited and potential risks are avoided.


