
NAS100 NDX Technical Analysis: The Nasdaq index ended last week with a notable positive performance, as last week witnessed a change in trend. The index closed at strong levels, recording a high before closing at $19,581 and a low at $19,314. These movements indicate the beginning of a significant rise after a period of volatility and a downward trend.
NAS100 NDX Technical Analysis: Key Changes
- Trading above the moving averages:
o The chart shows that the Nasdaq index has moved to trade above the moving average indicators, indicating the stability of the current upward trend and increasing strength in this trend.
- Positive signal from the MACD indicator:
o The MACD indicator has started to give positive signals, which reinforces the bullish outlook for the index. This positive crossover supports the possibility of continuing the upward trend in the short term.
NAS100 NDX Technical Analysis: Trading Opportunities
- Buying Opportunities:
o In case the upward trend continues, it is recommended to buy above the nearby resistance level. Therefore, it is preferable to enter at around $19,600, with an initial target of $19,620, as the continuation of the rise indicates the possibility of achieving further gains.
- Selling opportunities:
o If the market witnesses any decline, it can be exploited in selling operations. It is advisable to sell when the index falls below the nearby support level. Sell orders can be placed at around $19,290, with the price expected to target the next support levels.
NAS100 NDX Technical Analysis: Future outlook
As this week begins, the NASDAQ index appears to be in a strong position to support the upward trend. The index being above the moving averages and the positive MACD signal enhances the chances of a continued rise. The market is expected to witness volatility that may provide profitable opportunities for traders, but technical indicators should be carefully monitored to adjust trading strategies according to immediate developments.
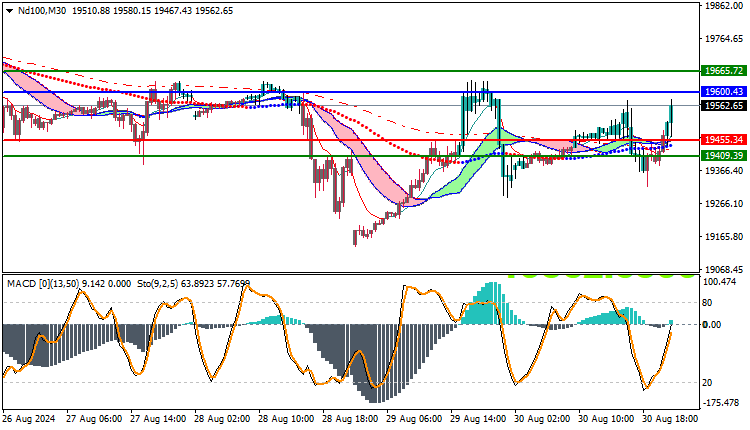
Trading strategies levels on Buy/Sell level
| ND100 | In case of buying | in case of selling |
| Entry point | 19600 | 19455 |
| Target Point 1 (TP1) | First resistance: 19665 | First support: 19409 |
| Target Point 2 (TP2) | Second resistance: 19720 | Second support: 19380 |
| Stop Loss (SL) | 19455 | 19600 |
The start of the week promises to be positive for the Nasdaq, with positive signals supporting the upward trend. Whether you are looking to buy or sell, make sure to follow the market movements closely and use support and resistance levels to guide your decisions. Maintain a flexible strategy and be prepared to adjust it as the market changes to ensure you make the most of the available opportunities.


