
NAS100 NDX Technical Analysis: The Nasdaq index is showing an upward trend today, recording its highest trading price so far at 21602.23 points and its lowest price at 21428.54 points. The index is currently trading at 21476.24 points, reflecting the continuation of the upward trend in the short term. This movement supports optimism in the market and improves the future outlook for the index.
NAS100 NDX Technical Analysis: Price Analysis
The Nasdaq index is trading above most of the moving average indicators, which reinforces the upward trend and reflects the purchasing power in the market. This movement indicates that the market is maintaining the upward momentum, as trading above these averages reflects investors’ preference to buy shares in the index.
Technical Analysis
Moving Averages and MACD Indicator:
- Moving Averages: Trading above the moving averages indicates strong support for the upward trend. If the market continues to move above these averages, the index is likely to continue rising. Moving averages act as a major support in case of short-term corrections or pullbacks.
- MACD Indicator: MACD indicates a positive trend, which enhances the possibility of continuing the upward momentum. The presence of a positive signal from this indicator indicates that the market is still in an upward phase, with the possibility of continuing the rises in the coming period.
Future Market Outlook:
Given trading above the moving averages and the positive signal from the MACD indicator, the Nasdaq index is expected to continue in an upward trend in the short term. However, the market may witness some fluctuations or minor corrections if it encounters strong resistance levels. In general, the future outlook remains positive in light of the support of the upward trend.
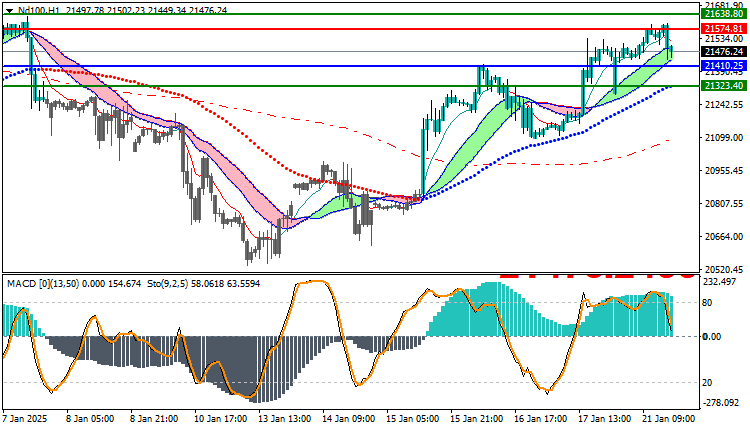
Trading strategies levels on Buy/Sell level
| ND100 | In case of buying | in case of selling |
| Entry point | 21574.81 | 21410.25 |
| Target Point 1 (TP1) | First resistance: 21638.80 | First support: 21323.40 |
| Target Point 2 (TP2) | Second resistance: 21710.00 | Second support: 21210.50 |
| Stop Loss (SL) | 21410.25 | 21574.81 |
The Nasdaq continues its upward trend today, supported by trading above the moving averages and a positive signal from the MACD. The uptrend appears sustainable in the short-term, with potential for further gains if the positive momentum continues. The market should be closely monitored for any sudden changes in momentum or trend shifts.


