
NAS100 NDX Technical Analysis: The Nasdaq Index is trading in a strong upward trend today, recording a high of $20,330 and a low of $20,146. Currently, the index is trading at $20,297, reflecting the continuation of the positive momentum.
NAS100 NDX Technical Analysis Technical Analysis:
Technical indicators indicate that the index is trading above the moving averages, which enhances the strength of the upward trend. The MACD indicator also shows clear positive momentum, which supports expectations of a continued rise in prices.
NAS100 NDX Technical Analysis Expectations during the day:
- In the event of an uptrend: If the index continues to stabilize above the $20,290 level, we may witness a rise towards the resistance levels at $20,350 and $20,400.
- In case of a decline: If the index breaks the $20,146 level, with confirmation from the MACD indicator, we may witness a decline targeting the support levels at $20,000 and $19,950.
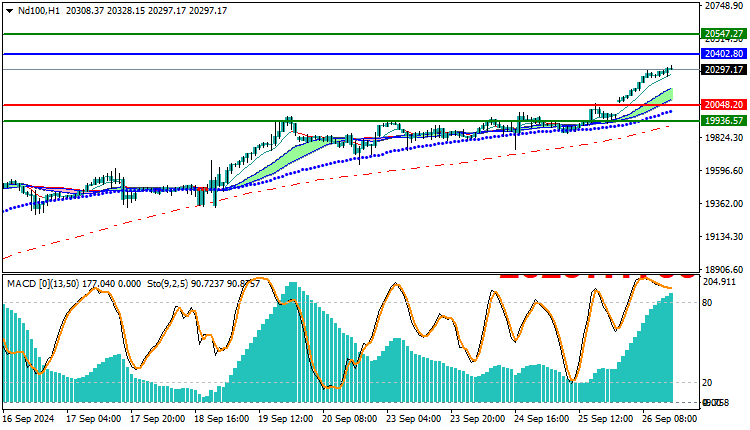
Trading strategies levels on Buy/Sell level
| ND100 | In case of buying | in case of selling |
| Entry point | 20402 | 20048 |
| Target Point 1 (TP1) | First resistance: 20547 | First support: 19936 |
| Target Point 2 (TP2) | Second resistance: 20620 | Second support: 19840 |
| Stop Loss (SL) | 20048 | 20402 |
The Nasdaq index reflects a strong upward trend, supported by positive technical indicators. It is advisable to closely monitor the price action to identify suitable opportunities to enter and exit the market.


