
NAS100 NDX Technical Analysis: The Nasdaq Index is trading in an upward trend today, as it recorded its highest price so far at 22070 and its lowest price at 21813, and is currently trading at 22048. The technical analysis indicates the continuation of the purchasing power in the market, which reinforces the upward trend of the index at the present time.
NAS100 NDX Technical Analysis: Technical Analysis
The index is trading above the moving averages, indicating that the upward trend is strongly supported. Trading above the moving averages reflects the positive superiority of buyers and indicates that the upward momentum may continue. This signal supports expectations of a continuation of the upward trend in the short and long term.
MACD Indicator:
The MACD indicator indicates a positive trend, as a bullish crossover appears between the two lines, reflecting the positive momentum of the market. The distance between the two lines indicates the continuation of the strength in the upward trend, which reinforces expectations that the index will continue to rise if the support from this positive momentum continues.
Outlook:
The Nasdaq is expected to continue its upward trend as long as prices remain above the moving averages, supported by the MACD indicator, which reflects continued positive momentum. It is important to follow any economic developments or news that may affect the markets, as economic data or geopolitical factors can lead to volatility that may affect the movement of the index.
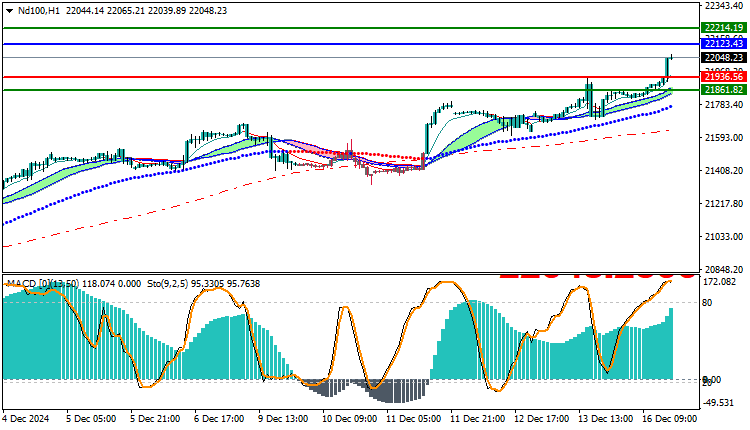
Trading strategies levels on Buy/Sell level
| ND100 | In case of buying | in case of selling |
| Entry point | 22123 | 21936 |
| Target Point 1 (TP1) | First resistance: 22214 | First support: 21861 |
| Target Point 2 (TP2) | Second resistance: 22280 | Second support: 21810 |
| Stop Loss (SL) | 21936 | 22123 |
The Nasdaq is in an uptrend supported by prices trading above the moving averages, as well as positive momentum shown by the MACD. If this support holds, the index is likely to continue making gains in the near term.


