
NAS100 NDX Technical Analysis: The Nasdaq Index is trading in a downtrend today, as it is trading below the moving averages, which strengthens the downtrend. The index fell from $20,095 to its lowest level today at $19,912, and is currently trading around $19,983.
NAS100 NDX Technical Analysis Price Analysis:
Current data indicates that selling pressures on the index continue, as the current price shows signs of a downtrend. Trading below the moving averages confirms the presence of selling strength.
NAS100 NDX Technical Analysis Strengths and Weaknesses:
- Strengths:
Trading below the moving averages, which indicates the continuation of the downtrend.
The support level at $19,912 may be considered an important point to monitor in case of any correction.
- Weaknesses:
MACD shows a negative trend, but also reflects a weakness in the downside strength, which may indicate a possible short-term correction or rebound.
NAS100 NDX Technical Analysis Trading Opportunities:
Opportunities appear to be available for entering short trades as long as the index is trading below $20,000. There should be a close monitoring of key technical levels to identify any potential changes.
NAS100 NDX Technical Analysis Technical Indicators Analysis:
- Moving Averages: Support the downside trend, indicating that the negative trend is still in place.
- MACD: Reflects a negative trend, but shows a decrease in the downside strength, which requires caution in making decisions.
NAS100 NDX Technical Analysis Trading Strategy:
Based on current data, it is preferable to take short positions as long as prices are trading below $20,000. The support level at $19,912 should be monitored, as this point could be critical in determining the next move.
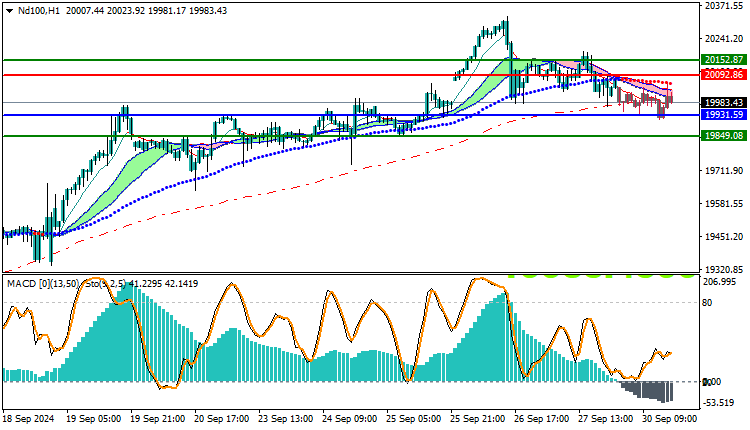
Trading strategies levels on Buy/Sell level
| ND100 | In case of buying | in case of selling |
| Entry point | 20092 | 19931 |
| Target Point 1 (TP1) | First resistance: 20152 | First support: 19849 |
| Target Point 2 (TP2) | Second resistance: 20195 | Second support: 19770 |
| Stop Loss (SL) | 19931 | 20092 |
The Nasdaq is showing a bearish trend with signs of weak selling power. Traders should remain cautious and watch the price action carefully to take advantage of opportunities while keeping in mind any positive signals that may appear in the future.


