
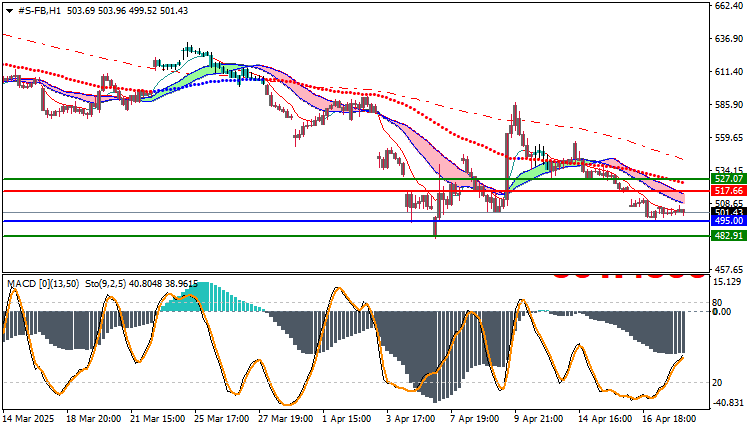
Meta stock (ticker FB) has declined significantly in recent weeks, affected by a general sell-off in technology stocks and a decline in risk appetite in the market. The H1 chart shows a clear downtrend, but the price is now close to critical support areas that could trigger a potential technical rebound.
Current Price and Market Trend
- Current Price: $501.43
- Overall Trend: Bearish
- Last Resistance Break: 517.66
- Nearest Support: 495.00, then 482.91
Price decline from a high of +635 to a low below +500
Weakening of short-term upward momentum
Consecutive bottoms likely to continue the decline unless the resistance of +517 is broken
Meta (FB) Stock Technical Analysis
General Trend:
The stock has been moving in a descending channel since late March, with the price unable to break the moving averages, reflecting continued selling pressure.
Technical Indicators:
- MACD: Remains negative, despite the beginning of a slight bullish crossover, indicating a limited potential rebound.
- Stochastic Oscillator: Rebounding from lower levels, indicating a potential upward correction.
- Moving Averages: All moving averages (20, 50, and 200) are pointing downward, and the price is below all of them.
Today’s Technical Forecast
Positive Scenario:
If the stock manages to hold above $495, we may witness a technical rebound targeting resistance at $511 and then $517.
Negative Scenario:
If $495 is broken, selling pressure will return, pushing the stock to test $482.90 and possibly lower.
Trading strategies based on Buy/Sell levels
| Facebook Stock | In case of buying | in case of selling |
| Entry point | 517.66 | 495.00 |
| Target Point 1 (TP1) | First resistance: 527.07 | First support: 482.91 |
| Target Point 2 (TP2) | Second resistance: 535.00 | Second support: 476.44 |
| Stop Loss (SL) | 495.00 | 517.66 |
Meta (FB) stock is showing a clear weakness in the trend, but we are approaching strong support areas that could represent the starting point for a temporary rebound. We recommend traders exercise caution and refrain from entering until support at 495 is broken or confirmed, or resistance at 511 is breached with a strong close.


