
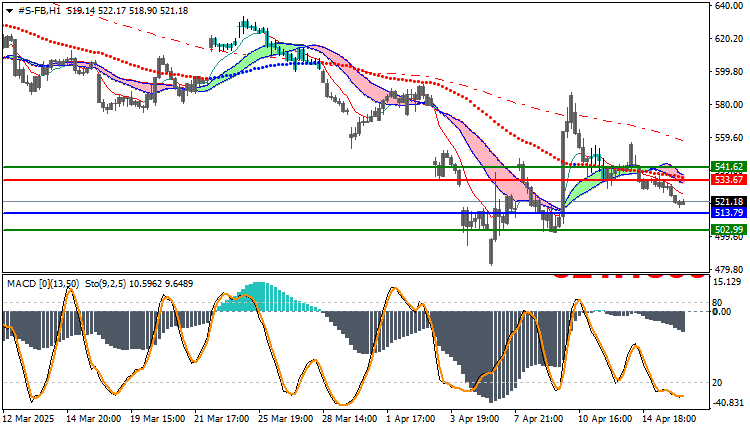
Amidst volatility and instability, Meta Platforms (FB) stock has been experiencing significant selling pressure during recent trading sessions, continuing its decline with a clear failure to break through strong resistance levels. In this technical analysis, we highlight price action on the hourly (H1) chart, assess momentum indicators, identify critical levels, and link current economic events to today’s stock movement forecasts.
Market and Price Overview
- Current stock price: $521.18
- Previous trading range: $518.90-$522.17
- General trend: Bearish since the end of March, with failed attempts at a rebound
The stock has clearly broken important support levels, reinforcing selling pressure, especially as the price continues to fail to hold above its moving averages. Sellers appear to be in control, supported by negative momentum from the RSI and a negative MACD crossover.
Detailed Technical Analysis
Technical Trend:
- General Trend: Bearish
- Moving Averages: The price is trading below the 20, 50, and 100 moving averages, supporting a sell-off scenario.
- Technical Indicators:
MACD: The crossover is still negative.
Stochastic: In oversold territory, but without strong rebound signals yet.
Today’s Impactful Economic Events
- US Federal Reserve members’ statements: These are expected to affect risk appetite in the markets.
- Earnings reports from major tech companies: especially Google and Netflix, which could push the sector’s stocks toward sharp volatility.
- US retail sales data: If they come in below expectations, they could put pressure on Wall Street as a whole, increasing pressure on Meta shares.
What to Expect Today? Trading Scenarios
- Sell Scenario (likely):
A continued break of the 520.99 support level could push the price to 511.79 and then 502.99.
As long as the price remains below 533.67, sellers will prevail.
- Buy Scenario (in case of a sudden rebound):
If the stock successfully surpasses 533.67, we may witness a short upward wave to 541.62.
Trading strategies based on Buy/Sell levels
| Facebook Stock | In case of buying | in case of selling |
| Entry point | 533.67 | 513.79 |
| Target Point 1 (TP1) | First resistance: 541.62 | First support: 502.99 |
| Target Point 2 (TP2) | Second resistance: 548.21 | Second support: 490.45 |
| Stop Loss (SL) | 513.79 | 533.67 |
Given the negative technical indicators and strong resistance levels that the price has failed to break, the downward trend remains dominant for Meta (FB) stock today. However, traders should monitor US economic announcements and technology sector news, as they may be the primary drivers of intraday volatility.


