
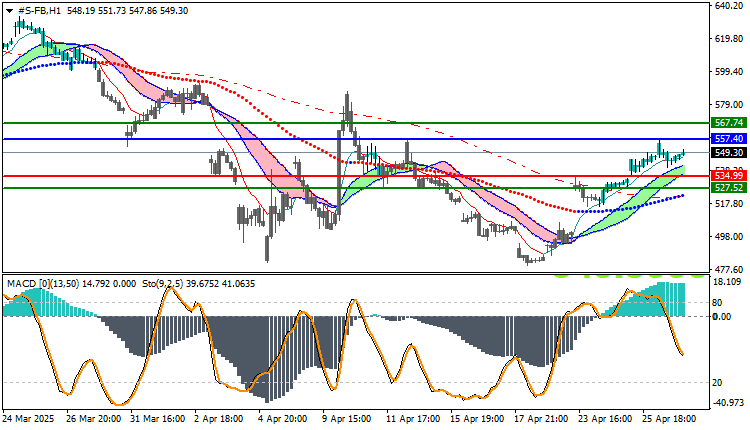
Meta (FB) stock has returned to the forefront of trading with a notable recovery in recent sessions, following a sharp decline in April. The H1 chart shows attempts to break through important resistance levels, attracting interest from traders looking for entry opportunities based on reliable technical signals.
Market Overview and Meta Stock Price
- Current price: 549.30
- Session high: 551.73
- General trend: Corrective uptrend
- Existing technical range: 534.99 support and 567.74 resistance
The stock benefited from the formation of a strong technical bottom near $517, starting a gradual upward trend supported by improving technical indicators and a stable sideways movement in major US indices.
Meta (FB) Stock Technical Analysis – H1 Timeframe
Technical Trend:
The short-term trend is bullish and corrective after breaking the descending channel and breaching the moving averages from bottom to top (EMA20, EMA50, and EMA100). The market structure is clearly visible in terms of rising lows.
Technical Indicators:
- MACD: Shows clear bullish momentum with strong positive bars, supporting the continuation of the current trend.
- Stochastic: Has begun to retreat from overbought areas, indicating a possible temporary decline before continuing the upward trend.
Meta Stock (FB) Technical Forecast Today – April 29, 2025
The stock is expected to continue its upward movement towards the resistance level of 557.40. If it breaks through with a clear close, the momentum may extend towards 567.74. However, if it fails to hold above it, we may witness a correction towards 534.99, a strong technical pivot point.
Suggested trading strategy:
- Buy if the price stabilizes above 550, with targets at 557–567
- Corrective sell if the breakout fails, with targets at 535–527
- Appropriate stop loss: Depending on the scenario, below 534.50 for a buy, or above 558 for a sell
Trading strategies based on Buy/Sell levels
| Facebook Stock | In case of buying | in case of selling |
| Entry point | 557.40 | 534.99 |
| Target Point 1 (TP1) | First resistance: 567.74 | First support: 527.52 |
| Target Point 2 (TP2) | Second resistance: 575.02 | Second support: 522.47 |
| Stop Loss (SL) | 534.99 | 557.40 |
Meta’s stock is showing promising short-term bullish signals, supported by technical momentum and improved liquidity, but caution is advised against any reversals at resistance areas. The daily technical analysis of this stock provides traders with a clear technical map that helps them make informed decisions.


