
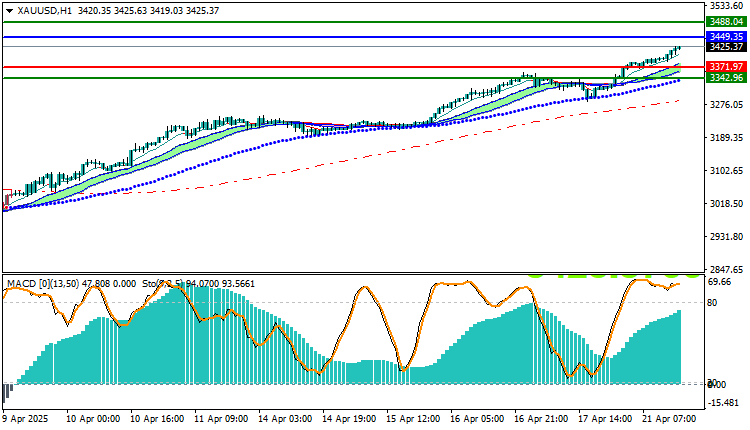
Gold prices continue to post notable gains this week, driven by a combination of geopolitical tensions, declining risk appetite in global markets, and a weaker US dollar. The H1 chart shows strong upward momentum, with a series of higher highs and higher lows.
Current Price and Market Conditions
- Current Price: $3,425.37 per ounce
- General Trend: Clearly Upward
- Nearest Resistance: 3,449 – 3,488
- Nearest Support: 3,371 – 3,342
Gold Trading at April Highs
Indicators Support Continuation of Uptrend
Moving Averages Support Buyer Dominance
Technical Analysis of Gold XAU/USD
General Trend:
Gold is moving within a consolidated ascending channel, exhibiting strong technical behavior with each new break above a resistance level that later turns into support.
Technical Indicators:
- MACD: Very positive, indicating strong buying momentum.
- Stochastic Oscillator: Overbought (above 90), which may herald a temporary correction.
- Moving Averages: The price is above all moving averages (20, 50, 200), confirming the uptrend.
Today’s Technical Forecast
Positive Scenario:
If the price stabilizes above 3,425, gold is expected to target 3,449 and then 3,488.
Negative Scenario:
If profit-taking occurs, the price may decline to test the 3,371–3,343 support zone, which is a potential buy zone if the price holds above it.
Trading strategies based on Buy/Sell levels
| XAUUSD | In case of buying | in case of selling |
| Entry point | 3449.35 | 3371.97 |
| Target Point 1 (TP1) | First resistance: 3488.04 | First support: 3342.96 |
| Target Point 2 (TP2) | Second resistance: 3499.44 | Second support: 3335.85 |
| Stop Loss (SL) | 3371.97 | 3449.35 |
The overall trend for gold is clearly positive, supported by technical indicators and moving averages, but volatility in the uptrend zones warrants caution. Traders are advised to focus on the support levels of 3,342 and 3,371 as entry opportunities, while monitoring the resistance level of 3,449 as a key to reaching new highs.


