
Gold Trend Now
Technical analysis of XAUUSD today. Gold prices have experienced sharp fluctuations over the past few days, driven by a strong US dollar and the resurgence of geopolitical concerns. After a strong rally that pushed the price towards the $3,345 level, the yellow metal retreated under clear selling pressure, currently trading near the $3,253 level. Signs of weakness are increasing on short-term timeframes, urging caution in trading decisions during today’s session.
Gold Trend Now : Gold Technical Overview
The current trend on the H1 hourly chart is bearish, after breaking the dynamic support of the moving averages, and the price failed to consolidate above the 3,280-3,300 range, which are key price congestion areas. The technical structure reinforces the possibility of a continued downward correction in the near term.
Technical Indicator Analysis
MACD: Strongly negative with a clear bearish crossover and a declining histogram, supporting continued selling momentum.
Stochastic: Moving within oversold areas, which may indicate a temporary rebound, but has not yet confirmed any reversal.
Moving Averages: The price is trading below the 50- and 100-day moving averages, further confirming the downtrend.
Gold Trend Now : Expected Scenarios for Gold
Bullish Scenario
If the price manages to break the 3260.58 area and hold above it, we may witness a rebound towards 3275.85 and then 3285.00, which are important resistance areas at the moment.
Any rise remains corrective as long as the price is below 3306.00.
Bearish Scenario
If gold fails to break 3260.58 again and hold above it, selling pressure will continue towards the support level of 3230.00, and a break above it could open the way towards 3195.00 as a subsequent technical target.
A break of 3195 is considered a signal for the resumption of the downtrend towards 3180 – 3165.
Detailed Explanation of Technical Zones
- 3285.00 – 3306.00: A strong resistance area representing the upper limit of the previous move – any rise below it is considered corrective.
- 3260.58: A current technical pivot – a break above or below it determines the immediate direction.
- 3230.00 – 3195.00: Key support areas – a break above them opens the way for broader declines.
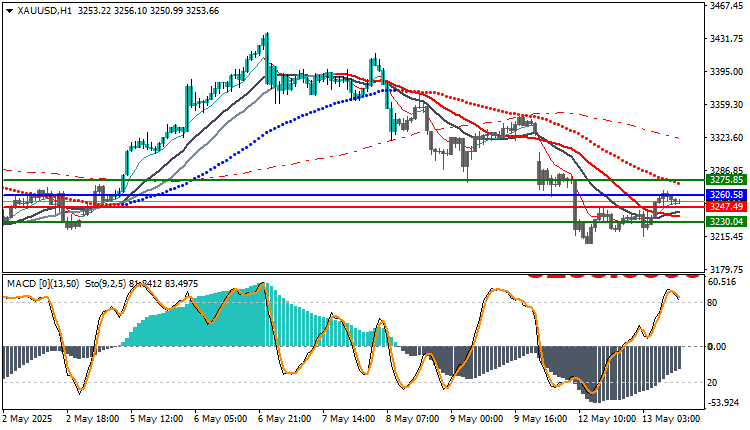
Trading strategies based on Buy/Sell levels
| In case of buying | in case of selling | XAU/USD |
| 3260.58 | 3247.49 | Entry point |
| First resistance: 3275.85 | First support: 3230.04 | Target Point 1 (TP1) |
| Second resistance: 3285.85 | Second support 3220.04: | Target Point 2 (TP2) |
| 3247.49 | 3260.58 | Stop Loss (SL) |
weak Gold is under clear selling pressure after failing to break through the 3300-3345 levels, which increases the chances of completing the correction towards the 3230 and then 3195 levels. Negative signals from indicators, along with the break of the moving averages, weaken the bullish scenario at the present time. Market reaction around the 3260-3280 levels should be monitored to determine future price action. Safe trading requires strict risk management in this volatile environment. Economic Data Impacting Gold This Week
- US CPI inflation data – Wednesday, May 15
- Fed members’ remarks
- Geopolitical reports and escalating global risks
Gold is highly sensitive to US dollar volatility and market risks. Any signs that the Fed may delay interest rate cuts will support the dollar and pressure gold.


