
Gold Technical Analysis XAUUSD: Gold is trading in a weak downtrend today after recording a high of 2915.89 and a low of 2879.18. Currently, gold is trading at 2913.50, reflecting some price volatility within a narrow range. Despite the weak downtrend, prices remain above the moving averages, which may indicate potential support for the upward movement.
Gold Technical Analysis XAUUSD: Technical Analysis
Technically, gold shows prices trading above the major moving averages, which indicates technical support for the upward trend. However, the current price action indicates a weak downtrend, indicating that the market is facing some hesitation between wanting to continue the upward trend or succumbing to bearish pressure.
At the same time, the MACD indicator indicates a weak negative trend, reflecting a decline in positive momentum. This signal may indicate a temporary decline in the bullish momentum, but with prices trading above the moving averages, the possibility of a bullish recovery in the near future remains.
Forward Outlook:
If gold continues to maintain its trading above the moving averages, it may witness some recovery and target nearby resistance levels at 2920.25, with a possible move towards 2930.21. However, if gold breaks the nearby support levels at 2903.45, we may see further decline towards lower support levels.
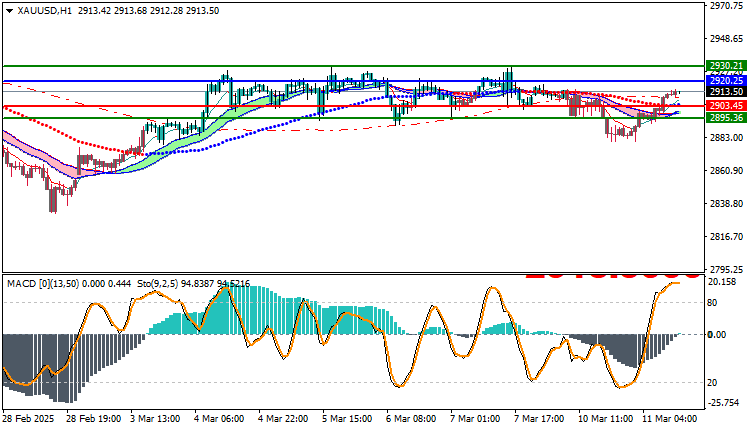
Trading strategies based on Buy/Sell levels
| XAUUSD | In case of buying | in case of selling |
| Entry point | 2920.25 | 2903.45 |
| Target Point 1 (TP1) | First resistance: 2930.21 | First support: 2895.36 |
| Target Point 2 (TP2) | Second resistance: 2937.20 | Second support: 2890.45 |
| Stop Loss (SL) | 2903.45 | 2920.25 |
The technical outlook for gold indicates a state of oscillation between a weak downtrend and potential support for an uptrend. Gold trading above the moving averages remains a positive sign with a slight decline in negative momentum, but developments in technical indicators should be carefully monitored to determine the next direction more accurately.


