
Gold Technical Analysis XAUUSD: Gold is trading in a downward trend at the beginning of this week, recording its highest trading price so far at 2905.12 and its lowest at 2879.35, currently trading near 2887. These movements may indicate that the market is facing a state of hesitation, with the beginning of a weakness in the downward momentum.
Gold Technical Analysis XAUUSD: Technical Analysis
Technically, prices appear to be trading below the moving averages, which supports the continuation of the downward trend in the short term. The MACD indicator also indicates a negative trend, reflecting the increasing selling pressure in the market. However, there are some signs of weakness in the strength of the downward trend, as there seems to be a decline in the level of selling demand, which may lead to a halt or correction in the current movement.
Trading Outlook:
If gold continues to trade below the moving averages, the downtrend may continue in the short term, but with the MACD weak and the lack of selling demand, we may see some corrections or sideways movement in the prices. If the current support levels are broken, it may reinforce the downtrend. However, it is important to watch for any change in momentum or buy signals that may change the situation.
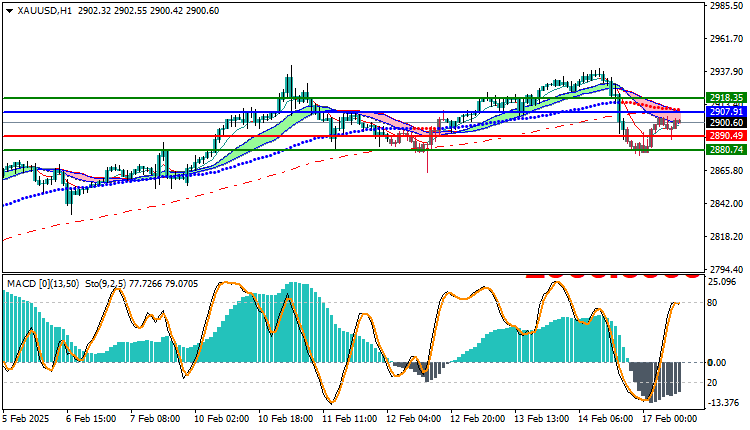
Trading strategies based on Buy/Sell levels
| XAUUSD | In case of buying | in case of selling |
| Entry point | 2907.91 | 2890.49 |
| Target Point 1 (TP1) | First resistance: 2918.35 | First support: 2880.74 |
| Target Point 2 (TP2) | Second resistance: 2925.12 | Second support: 2875.45 |
| Stop Loss (SL) | 2890.49 | 2907.91 |
Gold is trading in a downtrend supported by prices trading below the moving averages and negative signals from the MACD indicator. However, with the weakness in selling demand, we may see corrections or changes in the trend. Traders are advised to closely monitor market developments, especially with regard to key support levels, to identify future trading opportunities.


