
Gold Technical Analysis XAUUSD: In light of the current developments in the gold market, technical performance analysis shows the importance of using technical tools to understand future trends. We will review the technical analysis of gold, referring to basic indicators such as moving averages and the MACD indicator, and we will review the strengths and weaknesses of the market.
Gold Technical Analysis XAUUSD: Technical Analysis
The gold chart recently shows the beginning of a decline in the strength of the downward trend. After gold reached its lowest price today at $ 2471 per ounce, the market witnessed a positive rebound, as gold recorded its highest price at $ 2491 per ounce, bringing the current price to $ 2489 per ounce. Despite this corrective movement, the downward trend still dominates the market, especially since prices are trading below the moving average levels, which confirms the continuation of the downward trend in the short term.
Gold Technical Analysis XAUUSD: MACD Indicator
When analyzing the MACD indicator, we notice a decline in selling power. This signal indicates a weakness in selling pressure, which could be an indication of a possible bullish correction soon or a decline in the strength of the current downtrend. Despite the weakness of the selling signals, it should be noted that the general trend is still down, and this decline may be temporary.
Gold Technical Analysis XAUUSD: Strengths and Weaknesses in the Analysis
- Strengths:
- The general trend is still down, with prices trading below the moving averages
- The decline in selling strength may not be enough to change the general trend of the market.
- Weaknesses:
- The presence of signs of declining selling strength from the MACD indicator indicates a possible bullish correction.
- The current price action remains close to key support levels.
Gold Technical Analysis XAUUSD: The Future Outlook
Based on the current technical analysis, we may witness a short-term bullish correction in light of weak selling pressure, but the general trend remains down. It is recommended to closely monitor price movements and market indicators to determine the appropriate entry and exit times.
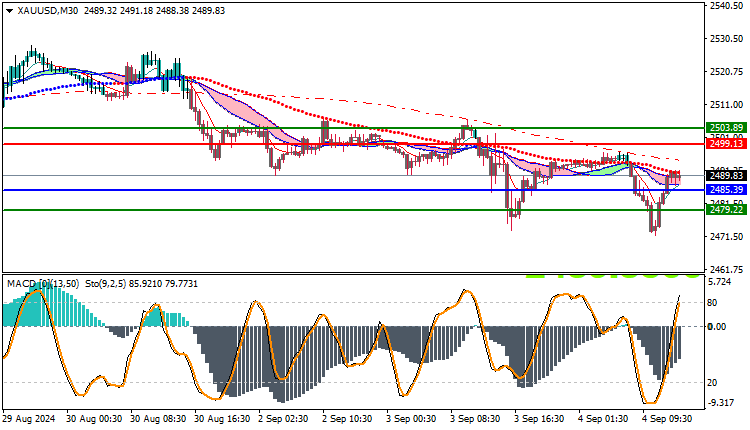
Trading strategies based on Buy/Sell levels
| XAUUSD | In case of buying | in case of selling |
| Entry point | 2499 | 2485 |
| Target Point 1 (TP1) | First resistance: 2503 | First support: 2479 |
| Target Point 2 (TP2) | Second resistance: 2508 | Second support: 2470 |
| Stop Loss (SL) | 2485 | 2499 |
Gold markets remain under bearish pressure at the moment, with technical indicators confirming a negative trend. It is essential to closely monitor price movements and interact with support and resistance levels to determine optimal entry and exit points. Trading strategies associated with technical analysis can help in making informed decisions based on current trends and future expectations.


