
Gold Technical Analysis XAUUSD: Gold prices recorded a significant increase today, reaching a high of $2524 per ounce, a low of $2503 per ounce, and a current trading price of $2510 per ounce. However, prices later declined due to the impact of US economic data, including the unemployment claims report, which negatively affected the gold market and pushed prices to trade below the moving averages.
Gold Technical Analysis: Technical Analysis
- Moving Averages: The data indicates that gold is currently trading below the moving averages, reflecting a weak upward trend. Prices remaining below these averages indicates the control of selling pressures and downside risks.
- MACD Indicator: The MACD indicator shows a weakness in positive strength, with negative crossovers indicating a decline in upward momentum. This enhances the possibility of a continued decline in prices and increases the negative impact of economic data.
Gold Technical Analysis XAUUSD: Recommendations
- Sell: It is recommended to monitor selling opportunities on bounces near the $2524 level, with downside targets towards the $2503 level.
- Buy: It is preferable to postpone any buying decisions until gold shows strong signs of regaining upward momentum and breaking the moving averages sustainably.
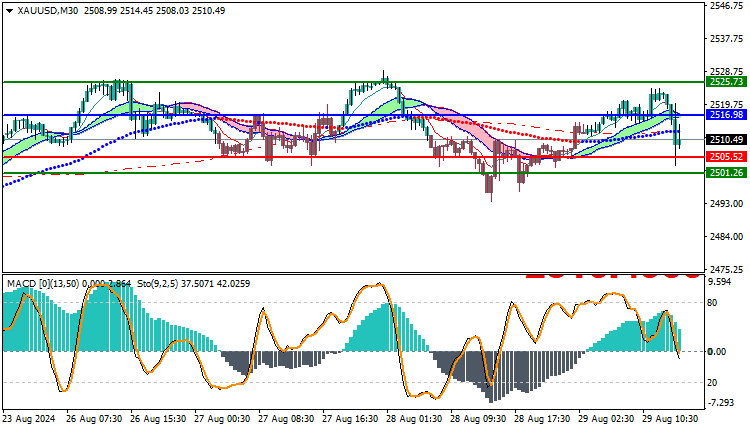
Trading strategies based on Buy/Sell levels
| XAUUSD | In case of buying | in case of selling |
| Entry point | 2516 | 2505 |
| Target Point 1 (TP1) | First resistance: 2525 | First support: 2501 |
| Target Point 2 (TP2) | Second resistance: 2533 | Second support: 2495 |
| Stop Loss (SL) | 2505 | 2516 |
Despite the rise in gold prices today, the US economic data had a noticeable impact on the market, which pushed prices down and traded below the moving averages. The MACD indicator indicates weak positive strength, which reinforces the negative outlook. It is necessary to closely monitor the market to adjust trading strategies according to any future changes in the trend.


