
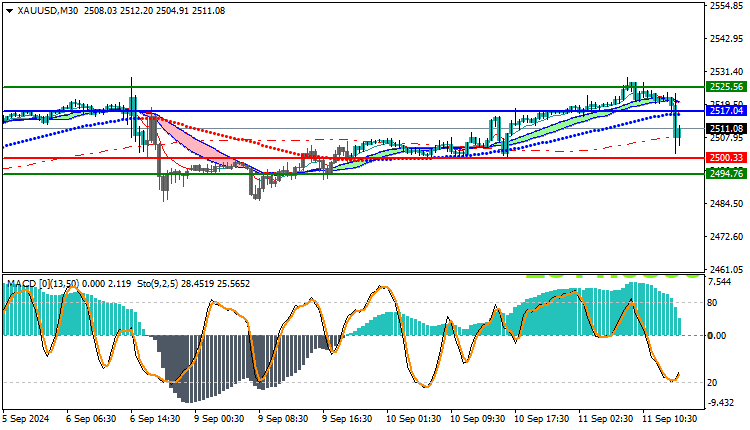
Gold Technical Analysis XAUUSD: Gold prices have witnessed a decline despite the ongoing upward trend. Gold has fallen from its high during the day at $2,530 per ounce to a low of $2,502 per ounce, and is currently trading at $2,511 per ounce.
Gold Technical Analysis XAUUSD: Price Analysis
Price decline: Gold prices are showing a decline compared to the high and low levels of the day, reflecting a weakness in the upward trend. However, the downward trend is not clearly visible on the chart, as prices continue to remain within a specific range.
Moving Average Indicator Analysis:
Price level compared to averages: Prices are currently trading below the moving averages, indicating a weakness in the upward trend. This arrangement indicates a possible shift in the trend towards the downside, especially if trading continues below these averages.
MACD Indicator Analysis:
Trend signals: The MACD indicator shows a decline in the strength of the positive trend, which may indicate a weakness in the upward momentum. This signal enhances the possibility of a shift in the trend towards the negative in the near future.
Gold Technical Analysis XAUUSD: Trading Opportunities
- Selling Opportunities: Selling opportunities can be considered if gold continues to trade below important resistance levels or if there are strong signs of a downward trend reversal. It is preferable to watch for any breakout of the key support levels at $2,502 per ounce as a selling opportunity.
- Buying Opportunities: In case of a trend reversal and the price holds above the support levels, buying opportunities can be considered if there are strong signs of a return of bullish momentum. The price action around the moving averages and the MACD indicator should be monitored for confirmation signals.
Trading strategies based on Buy/Sell levels
| XAUUSD | In case of buying | in case of selling |
| Entry point | 2517 | 2500 |
| Target Point 1 (TP1) | First resistance: 2525 | First support: 2494 |
| Target Point 2 (TP2) | Second resistance: 2533 | Second support: 2490 |
| Stop Loss (SL) | 2500 | 2517 |
The gold market is in a downtrend despite the overall uptrend, with prices trading below the moving averages and the MACD indicator showing weak positive trend strength. It is important to follow any additional signals of a trend reversal to determine appropriate trading strategies. At the moment, the dominant opportunities could be selling, with price action to be closely monitored for signals supporting a potential trend reversal.


