
Gold Technical Analysis XAUUSD: Our analysis of gold shows that the yellow metal has started a remarkable upward journey in recent sessions. At the beginning of the day, the price hit a low of $2,500 per ounce, and then rose to reach a high of $2,509. Currently, gold is trading at $2,505.
Gold Technical Analysis XAUUSD: Technical Analysis
- Moving Average Indicators: Technical analysis indicates that gold prices are trading above the main moving averages, which reinforces the positive signal. This phenomenon indicates the strength of the current upward trend and its resilience in the face of negative pressures.
- MACD Indicator: The MACD indicator indicates a clear upward trend, as the difference between the MACD line and the signal line accelerates in the positive zone. This confirmation contributes to strengthening our view of the market’s upward trend, which enhances the possibility of continuing the rise in the near term.
Gold Technical Analysis XAUUSD: Trading Opportunities
- Buying Opportunities: With gold continuing to trade above the moving averages and the emergence of positive signals from the MACD indicator, buying opportunities remain attractive. It is recommended to monitor the price around the $2500 level, as this could be a good entry point in case of a slight correction.
- Selling opportunities: For short trades, it is preferable to set stop loss levels below the strong support level at $2500. In case gold breaks through this area, it may be appropriate to re-evaluate the buying strategy or consider temporary selling options.
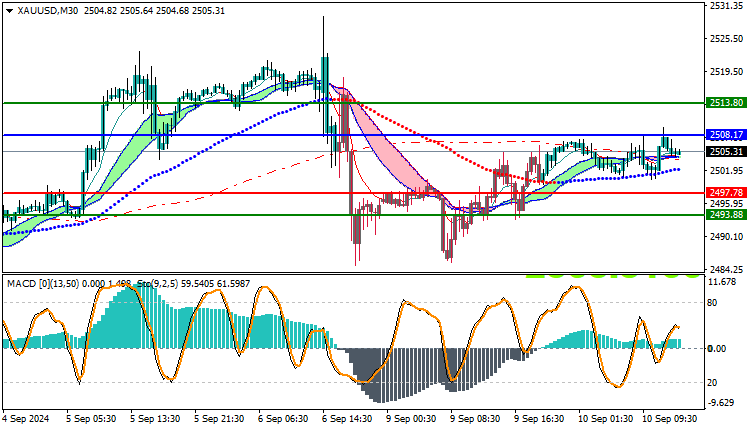
Trading strategies based on Buy/Sell levels
| XAUUSD | In case of buying | in case of selling |
| Entry point | 2508 | 2497 |
| Target Point 1 (TP1) | First resistance: 2513 | First support: 2493 |
| Target Point 2 (TP2) | Second resistance: 2520 | Second support: 2486 |
| Stop Loss (SL) | 2497 | 2508 |
Current technical analysis supports the continuation of the bullish trend for gold in the near term, based on positive price action and confirmations from market indicators. Investors should monitor key support and resistance levels to ensure informed trading decisions.


