
Gold Technical Analysis XAUUSD: The gold market is witnessing bullish movements today, as the precious metal benefits from strong technical support and positive expectations at the present time. The technical analysis reflects the continuation of the bullish momentum, with signals supporting the possibility of this trend continuing in the short term.
Gold Technical Analysis XAUUSD: General Trend Analysis
Gold recorded the highest trading price for the day at 2922.45 and the lowest price at 2900.78, as it is currently trading at 2916.38. These movements indicate the continuation of the bullish trend in the markets, as gold maintains its trading in a positive range despite some minor fluctuations.
Technical Analysis:
Technical data indicates that gold is trading above the moving average indicators, which reinforces and supports the bullish trend. This signal contributes to strengthening expectations of the continuation of the bullish momentum in the short term. The MACD indicator also shows positive signals supporting the current bullish trend, indicating that there are opportunities to achieve more gains if this momentum continues.
Trading Outlook:
Gold is expected to continue its upward trend if prices remain above the nearby resistance levels at $2925.66. If the level of $2937.69 is broken, gold may head towards higher resistance levels, such as $2845.20. However, in case of a correction, the support at $2900.78 is a vital level to watch.
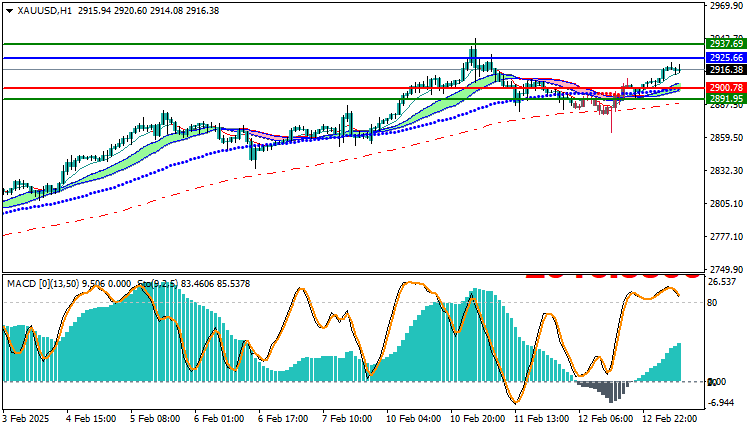
Trading strategies based on Buy/Sell levels
| XAUUSD | In case of buying | in case of selling |
| Entry point | 2925.66 | 2900.78 |
| Target Point 1 (TP1) | First resistance: 2937.69 | First support: 2891.95 |
| Target Point 2 (TP2) | Second resistance: 2845.20 | Second support: 2882.55 |
| Stop Loss (SL) | 2900.78 | 2925.66 |
Based on technical analysis, gold appears well positioned for further gains in the short term. Traders will prefer to follow the resistance levels at $2,925.66 and support at $2,900.78 to identify potential opportunities in this uptrend.


