
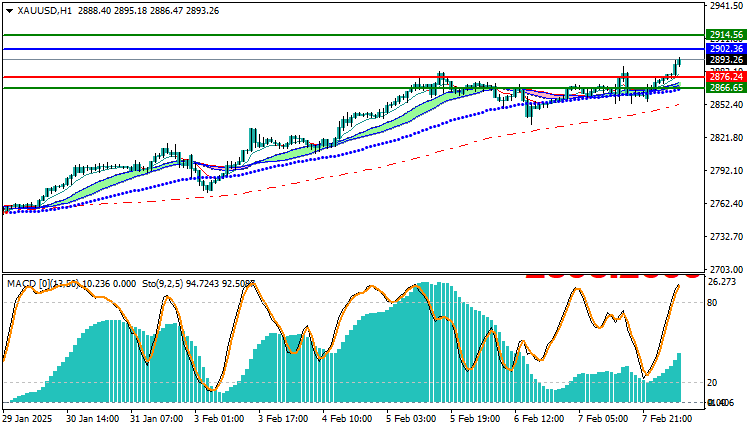
Gold Technical Analysis XAUUSD: Gold is trading in an uptrend on the first day of this week, continuing the upward momentum that started last week. Gold recorded the highest trading price for the day at 2893.65 and the lowest at 2853.59, and is currently trading at 2893.26. The price movement shows stability above the moving averages indicators, which enhances the strength of the rise. The MACD indicator also indicates a positive trend, which contributes to supporting the positive expectations for gold in the coming period.
Gold Technical Analysis XAUUSD: General Trend Analysis
Gold is currently trading in a strong uptrend, as it continues to achieve successive gains from last week. Prices are trading above the moving averages on all time periods, indicating that the upward momentum is still strong and that sellers are unable to control the market at the present time.
Moving Averages:
- The simple moving average shows that prices are continuously trading above these averages, which is a strong indicator that the upward trend is still ongoing.
- Since the price is still trading above these averages, this enhances the chances of continuing the upward trend in the short and medium term. If gold is able to maintain this trend, we may witness testing higher resistance levels in the coming period.
MACD Indicator:
- The MACD indicator shows clear positive signs, as the two lines (MACD line and signal line) are in an upward position, reflecting the continuation of the positive momentum.
- The distance between the two lines is still wide, indicating that the purchasing power remains strong and the upward trend continues without any signs of imminent decline.
- In general, the MACD indicator indicates that gold is in a state of upward strength.
with the possibility of continuing this momentum in the short term.
Future Outlook:
- If gold continues to trade above the main moving averages, the upward trend is expected to continue and reach the upcoming resistance levels at 2902.36. If these levels are exceeded, there may be an opportunity to test higher resistance levels such as 2914.56 or even 2919.42.
- Given the continued strength in the uptrend through indicators such as MACD and moving averages, gold may remain bullish if the positive momentum continues.
Trading strategies based on Buy/Sell levels
| XAUUSD | In case of buying | in case of selling |
| Entry point | 2902.36 | 2876.24 |
| Target Point 1 (TP1) | First resistance: 2914.56 | First support: 2866.65 |
| Target Point 2 (TP2) | Second resistance: 2919.42 | Second support: 2879.12 |
| Stop Loss (SL) | 2876.24 | 2902.36 |
Technical analysis of gold indicates that the uptrend is continuing at the moment.
supported by the price trading above the moving averages and the emergence of positive signals from the MACD indicator. If the buying momentum continues, gold is expected to continue its rise towards higher resistance levels. However, it is important to monitor the price action at these levels to notice any signs of a trend change or potential corrections.


