
Gold Technical Analysis XAUUSD: Gold is trading in an uptrend today, having recorded its highest trading price so far at $2679, and its lowest at $2660. Currently, gold is trading at $2678, indicating a continuation of the uptrend near the high of the day. Current moves support the positive trend with strong signals indicating the possibility of this trend continuing.
Gold Technical Analysis XAUUSD: General Trend Analysis
Gold is showing a continued uptrend today, as prices traded above the moving average indicators. This shows that the bullish momentum is still strong, supporting expectations that gold may continue to rise in the short term. Trading prices above the moving averages reflects the control of buyers in the market and enhances the chances of a continued rise.
Technical Analysis:
Moving Averages:
Prices are trading above the basic moving averages, indicating the strength of the bullish momentum in the market. This suggests that the general trend for gold is bullish, and that prices may face only slight resistance if they reach higher levels. The $2679 level remains the closest resistance at the moment, and if gold manages to break through it, we may see further upside.
MACD Indicator Analysis
The MACD indicator is indicating a positive trend, as its values are in the positive zone with good divergence between the MACD line and the signal line. This indicates that the bullish momentum in the market is strong, with clear strength in the upside. The positive trend can be expected to continue unless there are any major changes in the momentum.
Trading Expectations:
Based on the continued trading of prices above the moving averages, and with positive MACD signals, gold is expected to continue its bullish path in the short term. We may witness a test of the important psychological level at $2680, and if it manages to break through it, gold may continue to rise towards the $2700 levels or higher.
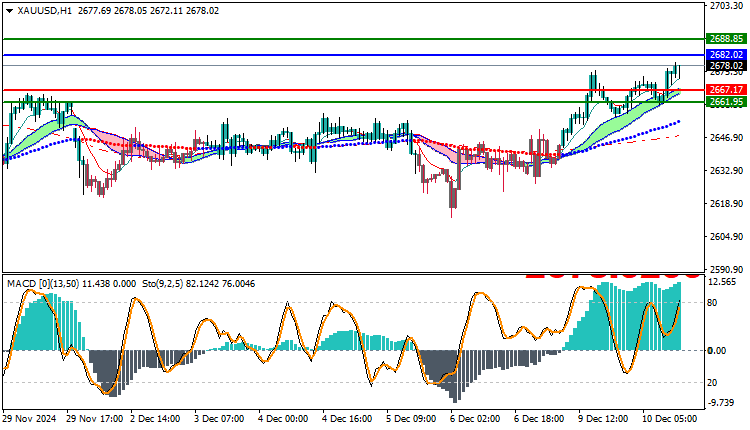
Trading strategies based on Buy/Sell levels
| XAUUSD | In case of buying | in case of selling |
| Entry point | 2678 | 2667 |
| Target Point 1 (TP1) | First resistance: 2682 | First support: 2661 |
| Target Point 2 (TP2) | Second resistance: 2688 | Second support: 2656 |
| Stop Loss (SL) | 2667 | 2678 |
Gold is showing a strong uptrend today supported by trading above the moving averages and the MACD indicator reflecting strength in the bullish momentum. Gold is expected to continue its rise in the short term.
with focus on key resistance levels such as $2679 and $2680.


