
Gold Technical Analysis XAUUSD: Gold is witnessing bullish trading during today’s session, as it recorded its highest price so far at $2921.87 per ounce, and its lowest price at $2900.80, to currently trade at $2913.74. This positive performance reflects the continuation of the bullish trend in gold, and enhances the possibility of this trend continuing in the coming period.
Gold Technical Analysis XAUUSD: Technical Analysis
Technically, gold is currently trading above the moving averages, which contributes to confirming the bullish trend. The MACD indicator is also showing positive signals, reflecting strong bullish momentum that supports the continuation of the current movement. These technical indicators indicate that the bullish trend may continue in the near term, which enhances the chances of achieving additional gains.
Future Expectations
If gold continues to trade above the moving averages, it is likely to face resistance at $2921.87, and if it is broken, gold may target higher levels towards $2936.19. In the event of a downward correction, the main support level is located at $2895.75, which may form a strong rebound point.
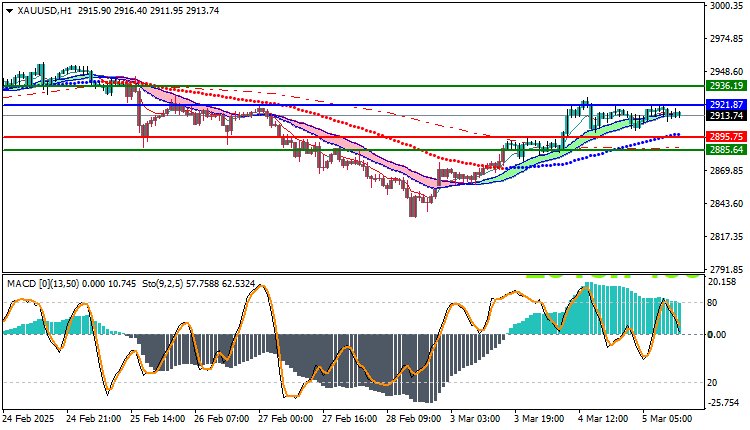
Trading strategies based on Buy/Sell levels
| XAUUSD | In case of buying | in case of selling |
| Entry point | 2921.87 | 2895.75 |
| Target Point 1 (TP1) | First resistance: 2936.19 | First support: 2885.64 |
| Target Point 2 (TP2) | Second resistance: 2940.12 | Second support: 2880.45 |
| Stop Loss (SL) | 2895.75 | 2921.87 |
Based on the current technical analysis, the overall trend for gold remains bullish in the near term. However, it is important to monitor any signs of changing momentum or shifts in technical indicators, as these factors may influence future price action.


