
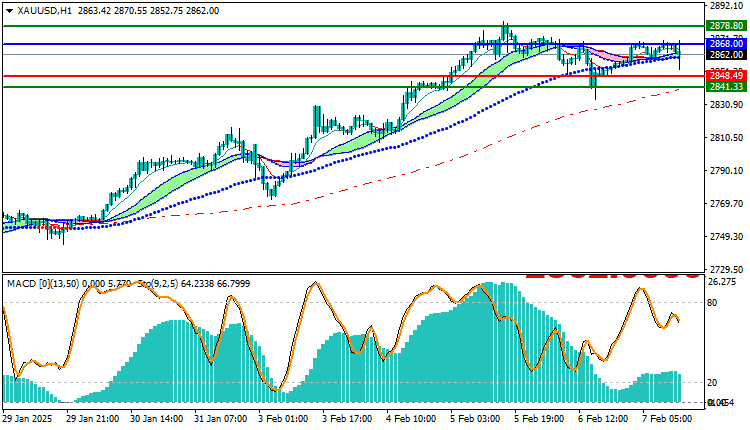
Gold Technical Analysis XAUUSD: The gold market is trading in an upward trend today, as it recorded the highest trading price for gold so far at 2870.99 and the lowest price at 2851.45, and is currently trading at 2862.00. The technical analysis indicates that the upward momentum continues, with signals supporting the positive trend.
Gold Technical Analysis XAUUSD: Price Analysis
Gold is currently trading above the moving averages indicators, which reflects the continuation of the upward trend in the market. Trading prices above these averages is a strong indication that the upward momentum is still continuing, which opens the door to the possibility of continuing the rise in the near future, as long as the price maintains these levels.
Technical Analysis
Moving Averages: The moving averages show that the general trend for gold is still upward, as the price is continuously moving above these averages. This indicates that the demand for gold is strong and the upward trend is supported by technical strength. If the price continues to trade above these averages, we may see further increases in the future.
MACD Analysis: MACD is showing positive signals, reflecting the bullish momentum in the market. This indicator indicates that the uptrend is strongly supported, which increases the likelihood of a continued rise. The positive trend in MACD indicates that the market reflects confidence in the uptrend, enhancing the chances of further gains.
Trading Expectations:
Given that gold is trading above the moving averages and the MACD is positive, gold is expected to continue its bullish trend in the near term. We may witness a test of higher resistance levels if the positive momentum continues to push the price higher. However, major support levels should be monitored, which may limit the price movement in case of a correction.
Trading strategies based on Buy/Sell levels
| XAUUSD | In case of buying | in case of selling |
| Entry point | 2868.00 | 2848.49 |
| Target Point 1 (TP1) | First resistance: 2878.80 | First support: 2841.33 |
| Target Point 2 (TP2) | Second resistance: 2884.12 | Second support: 2835.44 |
| Stop Loss (SL) | 2848.49 | 2868.00 |
Technical analysis suggests that gold is in an uptrend supported by prices trading above moving averages, as well as positive signals from the MACD indicator. If this momentum continues, we could see further price increases. However, traders should keep an eye on key resistance and support levels to identify any potential trading opportunities in the near future.


