
Gold Technical Analysis XAUUSD: The gold market is currently witnessing an upward movement, as the yellow metal is trading at higher levels compared to its lowest price for today. Based on price movements and technical indicators, it appears that the market is reflecting a positive trend, which supports expectations that the upward trend will continue in the upcoming sessions.
Gold Technical Analysis XAUUSD: Price Analysis
- Highest price recorded today: $2668.
- Lowest price recorded today: $2626.
- Current price: $2665.
This data indicates that gold has maintained strong levels during the day, with fluctuations between the lowest and highest prices, but in general it is moving within a positive range.
Technical Analysis:
- Moving Averages: Gold prices are currently trading above the main moving averages, which is a positive signal from a technical point of view. This trading above the moving averages indicates that the general trend in the market is bullish, which enhances the possibility of this trend continuing in the near term.
- MACD Indicator: The MACD indicator is also showing positive signs, as the intersection of the lines on the indicator reflects bullish momentum. This signal is one of the most important technical tools that support the bullish trend and increase investors’ confidence in the continuation of price increases in the near future.
Future Outlook:
Based on the current price analysis and technical indicators, gold is expected to continue its bullish trend during today’s session.
especially if it continues to trade above the moving averages. If it manages to surpass the nearby resistance levels at $2668, we may witness the continuation of the bullish momentum towards higher levels. On the other hand, in the event of a decline, the first support will remain at the $2626 level.
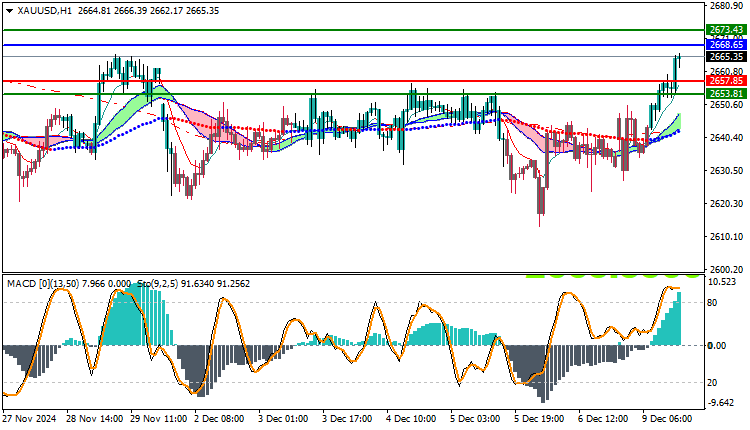
Trading strategies based on Buy/Sell levels
| XAUUSD | In case of buying | in case of selling |
| Entry point | 2668 | 2657 |
| Target Point 1 (TP1) | First resistance: 2673 | First support: 2653 |
| Target Point 2 (TP2) | Second resistance: 2679 | Second support: 2649 |
| Stop Loss (SL) | 2657 | 2668 |
The market is in a bullish mood today, supported by prices trading above moving averages and positive signals from the MACD indicator. The overall trend reflects good buying opportunities if gold continues to maintain these levels. Technical factors and fundamental price levels remain important factors in determining the direction of gold in the coming days.


