
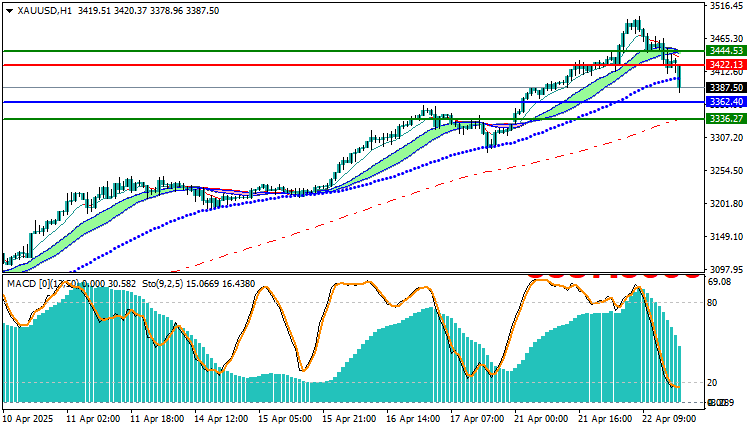
Gold Technical Analysis (XAUUSD): As of today, gold is trading at $3,387.50 per ounce, showing signs of a weak upward trend. Despite this modest bullish movement, the price remains below several key Moving Average crossovers, indicating lingering bearish pressure in the medium term. This suggests that although there is some upward momentum, it lacks the strength typically needed to sustain a major rally.
Adding to this perspective, the MACD (Moving Average Convergence Divergence) indicator shows only a weak positive signal. While not outright bearish, the lack of a strong bullish divergence points to market indecision and limited buying pressure. Traders should approach with caution, as momentum does not currently support a strong breakout to the upside.
Given these technical signals, a sell position could be considered.
particularly if the price fails to break above key resistance levels. A reasonable strategy would be to wait for a pullback to the $3,362.40 per ounce level before entering a short position. This level represents a potential pivot or confirmation point that the current upward move is losing steam.
For profit-taking, the $3,336.27 per ounce area is identified as a logical target, aligning with recent support levels and providing a favorable risk-to-reward ratio. Meanwhile, a stop-loss should be placed at $3,422.13 per ounce, just above recent highs, to limit losses in case the price breaks higher and invalidates the bearish setup.
In summary, while gold shows some upward drift, technical indicators point to a weak trend with a potential downside bias. Traders may find opportunities on the short side, provided the market confirms a reversal at key levels.
Gold Technical Analysis (XAUUSD): On the Other Side
On the other hand, if the $3422.13 buy zone is broken, the price may head to the $3444.53 zone.
Gold Technical Analysis (XAUUSD): Resistance and Support Levels
- Second Resistance: 3391.45
- First Resistance: 3389.10
- Pivot Level: 3387.68
- First Support: 3385.47
- Second Support: 3383.58


