
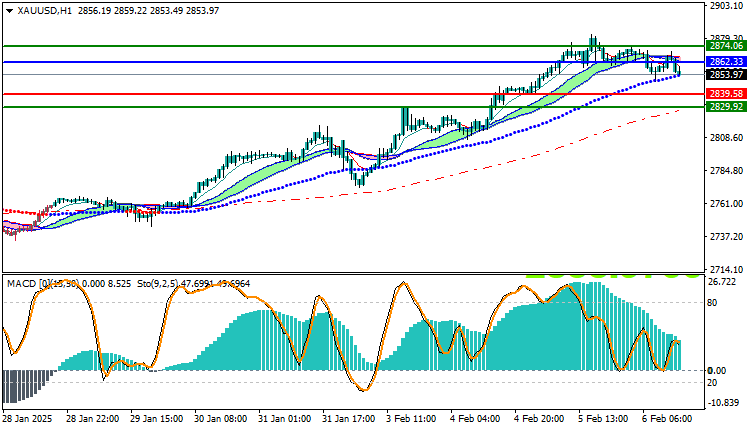
Gold Technical Analysis XAUUSD: Gold is trading in an upward range today, but with some signs of weakness in this trend. Gold recorded its highest price so far at $2871.99, while it recorded its lowest price at $2845.09, and is currently trading at $2853.97. The market is showing some volatility in price action, reflecting a state of uncertainty in the general direction.
Gold Technical Analysis XAUUSD: General Trend Analysis
Gold is currently witnessing an upward trend, but the market is suffering from some hesitation due to light selling pressure. Prices are trading below some short- and medium-term moving average indicators, which weakens the upward momentum and suggests a state of overbought.
Technical Analysis:
- Moving Averages: Prices are currently trading below the moving average, which indicates weakness in the upward trend, as prices are approaching testing strong support levels. If trading continues below these averages, we may see additional pressure on prices.
- MACD Indicator: The MACD indicator shows a positive trend, but at the same time, it indicates a weakness in the momentum. This signal indicates a decline in the possibility of continuing the rise strongly, and increases the possibility of a corrective movement in case prices fail to exceed strong resistances.
Best scenario for trading:
- If gold is able to break the $2862.33 level steadily, we may witness a resumption of the upward trend, with the possibility of testing the next resistance levels.
- However, if gold is unable to exceed these levels, and rebounds from the current levels or below them, the market may witness a corrective movement towards the support levels around $2839.58, and perhaps below that.
Trading strategies based on Buy/Sell levels
| XAUUSD | In case of buying | in case of selling |
| Entry point | 2862.33 | 2839.58 |
| Target Point 1 (TP1) | First resistance: 2874.06 | First support: 2829.92 |
| Target Point 2 (TP2) | Second resistance: 2879.00 | Second support: 2822.88 |
| Stop Loss (SL) | 2839.58 | 2862.33 |
Under the current technical analysis, the market is showing some weakness in the upside with mixed signals from the MACD and moving averages. The most likely scenario remains a range-bound oscillation, with a possible correction if prices fail to break the nearby resistance. The situation requires careful monitoring of the market, taking support and resistance levels into account to make informed decisions.


