
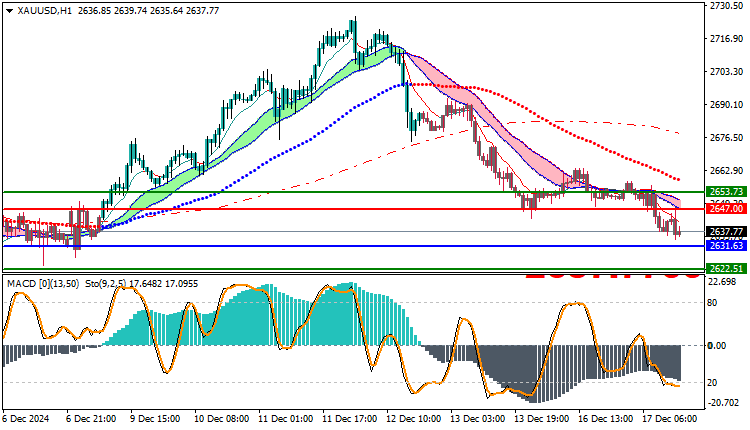
Gold Technical Analysis XAUUSD: Gold is currently witnessing a bearish trading movement, as it recorded a high price for the day at 2657 and a low price at 2634, and is currently trading near the 2637 level. The yellow metal appears to be under the influence of selling pressure, as the price is trading below the moving averages, which supports the continuation of the downward trend in the market.
Gold Technical Analysis XAUUSD: Technical Analysis
Moving Averages: Gold is currently trading below the main moving averages, which reflects the dominance of the downward trend in the short and medium term. Trading the price below these averages is a negative signal indicating weak upward momentum and the possibility of continued selling pressure.
- MACD Indicator: The MACD indicator is showing clear negative signals, as the indicator records low levels, reflecting increasing downward momentum. This signal supports the continuation of potential declines for gold in the short term.
Expectations:
In light of the continued trading of gold below the moving averages and the negative signals from the MACD indicator, the downward trend is expected to continue in the short term. If gold continues to trade below the current support levels at 2634, we could see further declines towards lower support levels, with a potential test of the 2600 area or lower.
Trading strategies based on Buy/Sell levels
| XAUUSD | In case of buying | in case of selling |
| Entry point | 2647 | 2631 |
| Target Point 1 (TP1) | First resistance: 2653 | First support: 2622 |
| Target Point 2 (TP2) | Second resistance: 2657 | Second support: 2615 |
| Stop Loss (SL) | 2631 | 2647 |
The overall trend for gold remains bearish, with the price trading below the moving averages and the MACD indicating strong selling momentum. Therefore, gold is likely to continue its downtrend in the short term.
with the next support levels to be seen that could influence the price action.


