
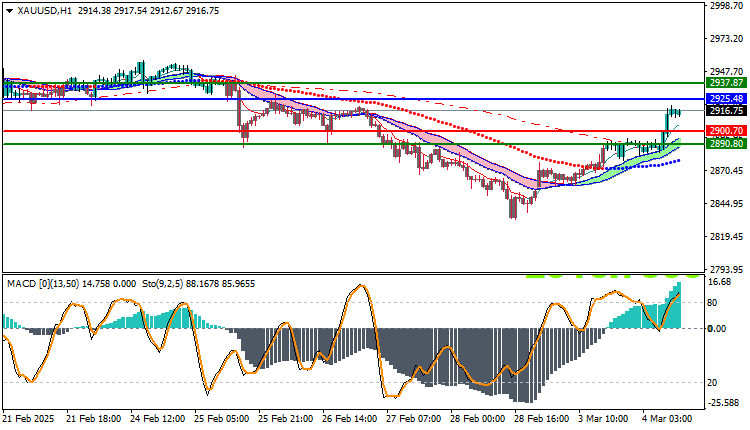
Gold Technical Analysis XAUUSD: Gold continues to trade in an upward trend today, recording its highest trading price so far at $2922.18, while recording its lowest price at $2884.19. Currently, gold is trading at $2916.75, reflecting the continued bullish momentum in the market.
Gold Technical Analysis XAUUSD: Technical Analysis
By observing the current price action, we notice that gold is trading above the main moving average indicators, which reinforces the bullish trend hypothesis. This signal supports expectations that gold will continue to move in a positive direction in the short and medium term. The MACD indicator also shows positive signals, reflecting the strength of the bullish momentum and showing that the current trend is supported by strong dynamics.
Forward Outlook:
Gold’s continued trading above the moving average levels reinforces expectations of a continued rise towards higher resistance levels. If gold is able to surpass the $2925.48 level, it may head towards higher levels in the coming days. Despite this positivity, traders should remain alert to watch for any pullbacks that may occur, as the current support level at $2,900.70 could be a crucial point in the event of any decline.
Trading strategies based on Buy/Sell levels
| XAUUSD | In case of buying | in case of selling |
| Entry point | 2925.48 | 2900.70 |
| Target Point 1 (TP1) | First resistance: 2937.87 | First support: 2890.80 |
| Target Point 2 (TP2) | Second resistance: 2946.21 | Second support: 2882.40 |
| Stop Loss (SL) | 2900.70 | 2925.48 |
Based on technical analysis, gold is trading in an uptrend supported by positive momentum from technical indicators. The market remains in a bullish mood, and gold is likely to continue its upward trajectory as long as prices continue to trade above key support levels. Traders are advised to carefully monitor market developments, especially in the ongoing uptrend, to capitalize on potential opportunities.


