
Gold Technical Analysis XAUUSD: Gold continues its upward trend during today’s trading, as it recorded its highest trading price so far at 2922.36 and its lowest price at 2897.11, and is currently trading at 2918.86. These movements indicate the continuation of the buying pressure on the yellow metal at the present time, which reflects the increase in demand for it.
Gold Technical Analysis XAUUSD: Technical Analysis
Technically, it appears that gold prices are currently trading above the moving average indicators on various time periods, which enhances the strength of the bullish trend at the present time. The MACD indicator also reflects positive signals, as it continues to move in the positive zone with a tendency towards the rise, which supports expectations of continued bullish momentum.
Moving Averages:
The moving averages indicate that the market is heading in a strong bullish trend, as prices are trading above the simple moving averages (SMA) on all time periods, which enhances the possibility of continuing the bullish trend in the short and medium term. This situation supports the positive outlook for gold.
MACD Indicator:
The MACD indicator is providing positive signals, as the MACD line is trading above the signal line, indicating the continuation of the bullish momentum. The gap between the two lines also confirms the positive momentum in the market, which enhances the possibility of higher prices in the near future.
Future Outlook:
In light of the current technical data, gold is expected to continue its upward trend in the near term. If gold continues to trade above the key support levels, we may see further gains towards the levels of 2928.88 and 2941.10. However, any signals that may indicate a possible correction or pullback should be monitored in case of any market volatility.
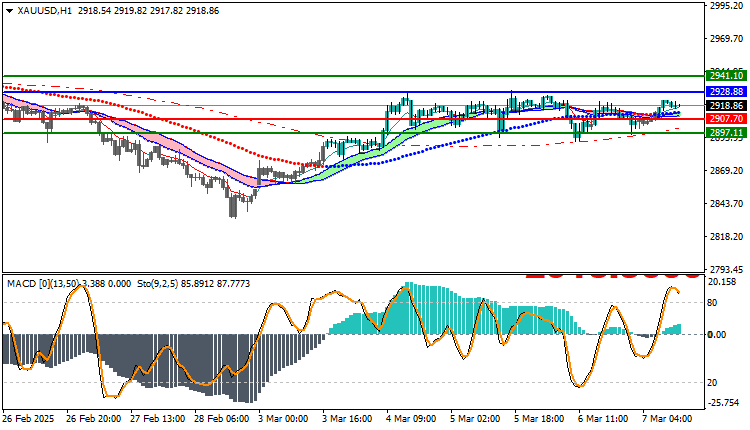
Trading strategies based on Buy/Sell levels
| XAUUSD | In case of buying | in case of selling |
| Entry point | 2928.88 | 2907.70 |
| Target Point 1 (TP1) | First resistance: 2941.10 | First support: 2897.11 |
| Target Point 2 (TP2) | Second resistance: 2928.55 | Second support: 2895.23 |
| Stop Loss (SL) | 2907.70 | 2928.88 |
Gold is showing continued bullish momentum, supported by prices trading above moving averages and positive signals from the MACD indicator. The outlook remains positive as long as gold continues to trade above key support levels.


