
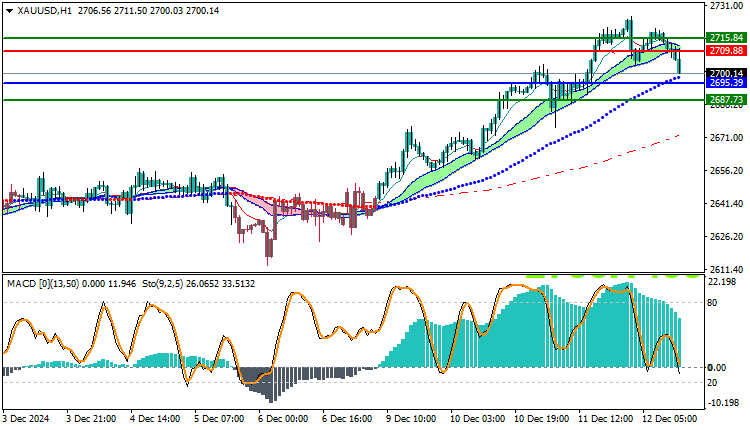
Gold Technical Analysis XAUUSD: Gold is trading in a weak bullish trend today, as the precious metal recorded its highest trading price at 2726, and the lowest price at 2695, and is currently trading at 2700. The price movement appears below the moving averages, which reduces the chances of the bullish trend continuing in the short term.
Gold Technical Analysis XAUUSD: Technical Analysis
- Moving Averages: Gold trading below the main moving averages indicates a weakness in the current bullish trend, which reduces the possibility of its continuation and reflects selling pressure in the near term.
- MACD Indicator: The MACD indicator indicates a positive trend, but with a decline in the upward momentum, which reflects the possibility of a weak positive movement in the near future. This decline in momentum comes after a period of positive trading.
Economic Data and Its Impact on Trading:
US Producer Price Index (PPI) data came out positive, which negatively affected gold. An increase in the Producer Price Index means a potential increase in inflation in the US economy, which enhances expectations of an increase in interest rates by the US Federal Reserve. This could lead to weak demand for gold as a safe haven, thus negatively impacting prices.
Trading strategies based on Buy/Sell levels
| XAUUSD | In case of buying | in case of selling |
| Entry point | 2709 | 2695 |
| Target Point 1 (TP1) | First resistance: 2715 | First support: 2687 |
| Target Point 2 (TP2) | Second resistance: 2720 | Second support: 2680 |
| Stop Loss (SL) | 2695 | 2709 |
Based on technical analysis and current economic data, gold remains in a weak uptrend, but is likely to come under pressure if expectations of a US rate hike persist. Economic developments, especially US inflation indicators, should be monitored, as they could significantly impact gold’s short-term direction.


