
Gold Technical Analysis XAUUSD: Gold is trading in a bearish trend today, as it recorded the highest trading price for the day so far at $2611 and the lowest price at $2601, with the current price reaching $2604. This downward movement reflects the presence of selling pressure in the market, indicating the possibility of the downward trend continuing if the negative momentum continues.
Gold Technical Analysis XAUUSD: Price Analysis
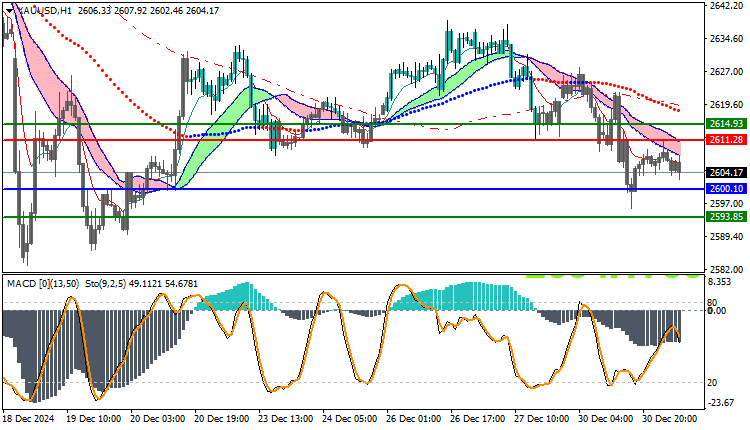
Prices are currently trading below the major moving averages, which indicates a weakness in the upward momentum and supports the downward trend. Gold remaining below these averages reinforces the negative scenario, which means that the markets prefer to sell rather than buy at the present time. This movement below the moving averages indicates the possibility of continued selling pressure in the near future.
Technical Analysis
Moving Averages: Moving average indicators show that gold is trading below the major moving averages, reflecting the dominance of the downward trend. The short-term averages are below the long-term averages, which supports the idea that the market is in a downward trend. If gold continues to trade below these moving averages, it is likely to face further selling pressure in the coming days.
MACD Analysis: The MACD indicator is indicating a negative trend, as the negative crossover between the lines appears and reflects increasing bearish momentum. The increasing distance between the lines indicates that the downtrend may continue, which reinforces the negative outlook for prices in the short term. The MACD indicator reflects a weakening in the bullish momentum, which may lead to further declines in prices.
Trading Expectations:
The downtrend is expected to continue in the short term if the price continues to trade below the moving averages. If the selling pressure continues, gold may test a nearby support level at $2,600. If this level is broken, the decline may extend towards $2,590. On the other hand, if the resistance level at $2,615 is broken, the market may witness a temporary upward correction.
Trading strategies based on Buy/Sell levels
| XAUUSD | In case of buying | in case of selling |
| Entry point | 2611 | 2600 |
| Target Point 1 (TP1) | First resistance: 2614 | First support: 2593 |
| Target Point 2 (TP2) | Second resistance: 2618 | Second support: 2584 |
| Stop Loss (SL) | 2600 | 2611 |
Gold is currently showing clear signs of a downtrend, trading below the moving averages.
and the MACD indicator reflects the beginning of a negative trend. The market is likely to remain under selling pressure in the short term.
with the need to monitor the developments of technical indicators to determine whether the downtrend will continue or whether any changes will occur that may reverse the current trend.


