
Gold Technical Analysis XAUUSD: Gold is trading in a bearish trend during today’s trading, with some fluctuations in the price movement recently. The yellow metal recorded the highest price for the day so far at 2607 and the lowest price at 2589, while it is currently trading at the level of 2605. This movement indicates the continuation of selling pressure on gold, but with some fluctuations in the direction.
Gold Technical Analysis XAUUSD: Technical Analysis
Through technical analysis, we notice that prices are trading below the moving averages indicators, which reinforces the idea of the continuation of the downward trend. At the same time, the MACD indicator is showing negative signals, indicating that the downward trend is still in place. However, the indicator’s crossovers indicate weakness in the downward force, which means that the decline may witness fluctuations or a slowdown in the selling momentum at the present time.
Fundamental Analysis:
On the economic side, investors are awaiting the release of the Core Personal Consumption Price Index (PCE) data in the United States, which is an important measure of inflation. This data could have a significant impact on the markets, especially on gold, as it is likely to cause significant price movements depending on the results of the index.
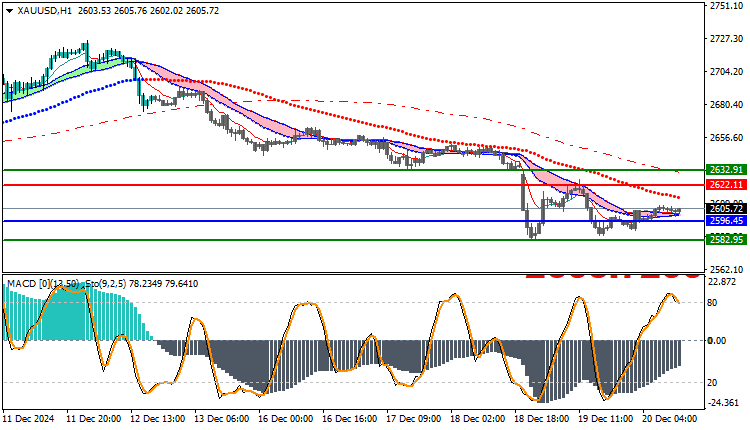
Trading strategies based on Buy/Sell levels
| XAUUSD | In case of buying | in case of selling |
| Entry point | 2622 | 2596 |
| Target Point 1 (TP1) | First resistance: 2632 | First support: 2582 |
| Target Point 2 (TP2) | Second resistance: 2638 | Second support: 2574 |
| Stop Loss (SL) | 2596 | 2622 |
Based on technical and fundamental analysis, gold appears to be continuing its downtrend.
with signs of weakness in the downtrend according to the MACD indicator. With the US PCE data due, the market is expected to witness additional volatility that could impact gold’s direction in the near term.


