
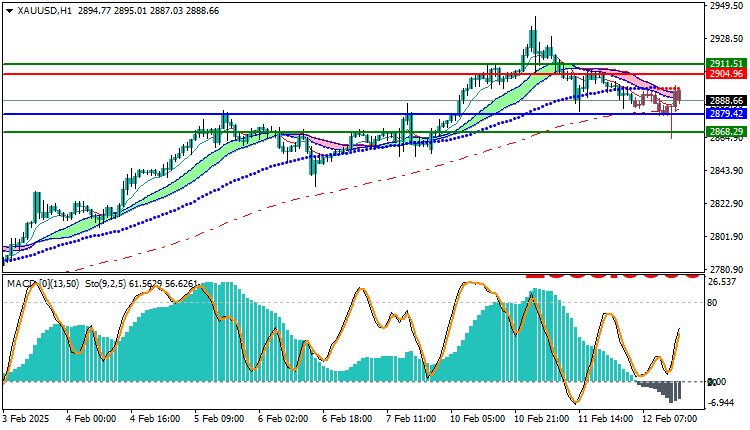
Gold Technical Analysis XAUUSD: The oil market recorded a bearish trend today with a clear weakness in the downward force. The pair reached the highest trading price so far at $2897.76, and the lowest price at $2864.36, and is currently trading at $2888.66 per barrel. The market is currently showing volatility around these levels, with a slight tendency towards the downward trend, but with a clear weakness in the downward momentum.
Gold Technical Analysis XAUUSD: Technical Price Analysis
Within the framework of technical analysis, the market is currently appearing below the moving average indicators, reflecting that the downward trend dominates the trading. However, the technical data indicates a weakness in the downward force, as there does not seem to be a strong push for prices towards the decline, which is clearly shown in the MACD indicator, which reflects negative signals, with a clear weakness in the negative trend.
Future Outlook:
The market is expected to continue to fluctuate around the current levels if the downward force continues to weaken. If the price continues to trade below the moving averages, we may see further declines, but with the weak momentum, the downside movement may be limited. In case the price bounces above the $2906.46 levels, we may see a corrective attempt to the upside.
Trading strategies based on Buy/Sell levels
| XAUUSD | In case of buying | in case of selling |
| Entry point | 2906.46 | 2880.93 |
| Target Point 1 (TP1) | First resistance: 2920.59 | First support: 2869.87 |
| Target Point 2 (TP2) | Second resistance: 2925.14 | Second support: 2864.12 |
| Stop Loss (SL) | 2880.93 | 2906.46 |
Technical analysis suggests that oil is in a downtrend with a weaker downtrend, reflecting market indecision. It is important to monitor key support and resistance levels, as they can provide important signals to determine the next trend.


