
Gold Technical Analysis
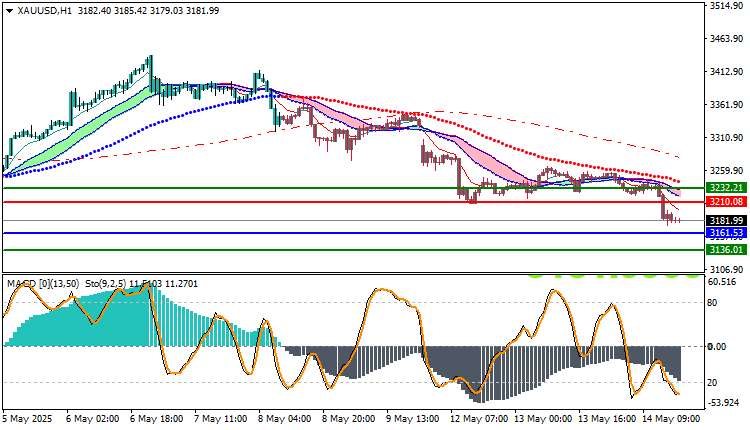
Currently, gold is trading at $3,181.99 per ounce, and the market shows signs of a bearish trend. The price is positioned below key Moving Averages, signaling downward momentum. These technical indicators suggest that sellers are in control, with the price failing to break above significant resistance levels.
The MACD (Moving Average Convergence Divergence) also supports the bearish outlook, indicating a negative trend. The MACD line is below the signal line, and the histogram remains in the red, further confirming that downward pressure is dominant in the market.
In light of these bearish signals, a potential selling opportunity presents itself. If the price continues its decline, the first level to watch for a drop is $3,161.53 per ounce. If this level holds and the price moves further down, the next area of interest for profit-taking lies at $3,136.01 per ounce. This would be the ideal point to close the position and secure profits, assuming the bearish trend continues.
For risk management, it’s crucial to set a stop-loss order. The $3,210.08 per ounce level would be an appropriate stop-loss, as it represents a key resistance area where the price may reverse if it breaks above. This stop-loss placement limits potential losses if the market turns against the bearish bias.
Overall, the current technical setup suggests a bearish outlook for gold, and traders could look for selling opportunities, with a focus on the key support levels at $3,161.53 and $3,136.01, while managing risk with a stop-loss at $3,210.08.
Gold Technical Analysis (XAUUSD): On the Other Hand
On the other hand, if the $3210.08 buy zone is broken, the price may head to the $3232.21 zone.
Resistance and Support Levels
- Second Resistance: 3186.55
- First Resistance: 3184.25
- Pivot Level: 3182.20
- First Support: 3180.55
- Second Support: 3178.41


