
Gold is trading today at $2624 per ounce in an uptrend on the hourly time frame. The price is moving above most of the moving average crossovers, which supports the uptrend, despite some signs of weakness in momentum from the MACD indicator. In this analysis, we will discuss the technical outlook for gold, taking into account future expectations based on technical indicators.
Gold Technical Analysis: Technical Outlook
On the hourly time frame, gold continues its upward movement supported by the price trading above the moving average crossovers (such as the 50 and 100 period averages). This indicates that the general trend is still positive, despite some signs of slowing momentum.
The MACD indicator shows a continuation of the uptrend, but there are signs of weak momentum. As the gap between the negative and positive lines has started to narrow, which may indicate the possibility of a correction or slowdown in the upward movement during the coming period. Despite this, the general trend is still bullish unless a break below the moving averages occurs.
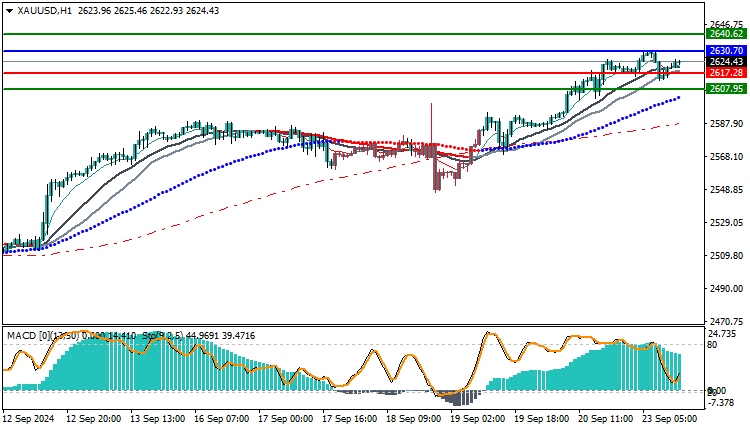
Trading strategies based on Buy/Sell levels
| XAUUSD | In case of buying | in case of selling |
| Entry point | 2630 | 2617 |
| Target Point 1 (TP1) | First resistance: 2640 | First support: 2607 |
| Target Point 2 (TP2) | Second resistance: 2650 | Second support: 2597 |
| Stop Loss (SL) | 2617 | 2630 |
Gold continues its uptrend supported by trading above the moving average crossovers, despite some signs of weakness in momentum from the MACD indicator. Given these signs, the overall trend is expected to remain positive in the short term, but traders should watch for any additional signs of weakness that may indicate a potential correction in the price.


