
After a strong upward trend that pushed gold closer to the $3480 level, the price began to decline, with clear technical signs that the market is entering a correction phase. With the continued impact of economic data and global volatility, investors are anticipating whether this decline is temporary or the beginning of a larger trend reversal.
A Look at Price Action
- Current Price: 3426.97
- Recent High: 3478.13
- Current Trend (H1): Upward with the Beginning of a Correction
- Nearest Support: 3388.51
- Immediate Resistance: 3450.13
Gold is currently trading below the 3450 resistance level after a profit-taking wave that began from this week’s high, which could mark the beginning of a temporary correction if the selling momentum continues.
Technical Analysis
Technical Indicators:
- MACD: Showing a clear negative crossover with an accelerating decline, confirming selling pressure.
- Stochastic: If the price is oversold below the 20 level, it may witness a short-term corrective bounce.
Gold Forecast Today – Trading Scenarios
Bullish Scenario (Technical Bounce):
- If the price rebounds from the support at 3388.51, it may return to test 3450.13, then 3478.13 if technical indicators improve.
Bearish Scenario (Continued Correction):
- A break of 3388.51 will push the price towards 3366 and possibly 3330, especially if US data is positive for the dollar.
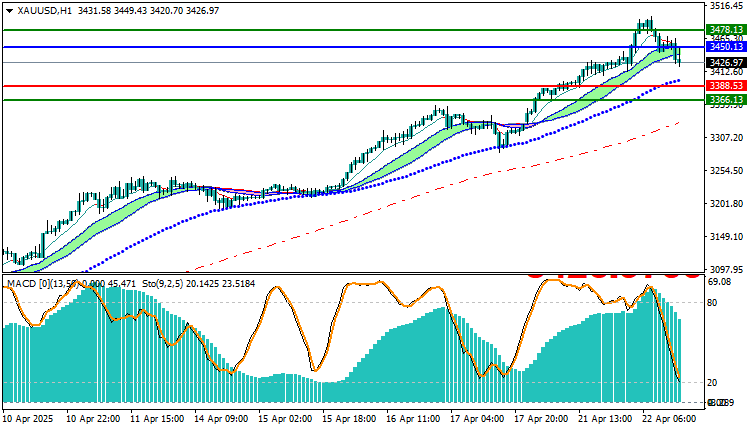
Trading strategies based on Buy/Sell levels
| XAUUSD | In case of buying | in case of selling |
| Entry point | 3450.13 | 3388.53 |
| Target Point 1 (TP1) | First resistance: 3478.13 | First support: 3366.13 |
| Target Point 2 (TP2) | Second resistance: 3487.14 | Second support: 3358.14 |
| Stop Loss (SL) | 3388.53 | 3450.13 |
Despite the strong uptrend, clear technical correction signs are emerging for gold, with a decline from the previous high. Continued selling momentum depends on the price’s ability to break the support at 3388.51. Conversely, any technical rebound signals from this area could represent a short-term buying opportunity.


