
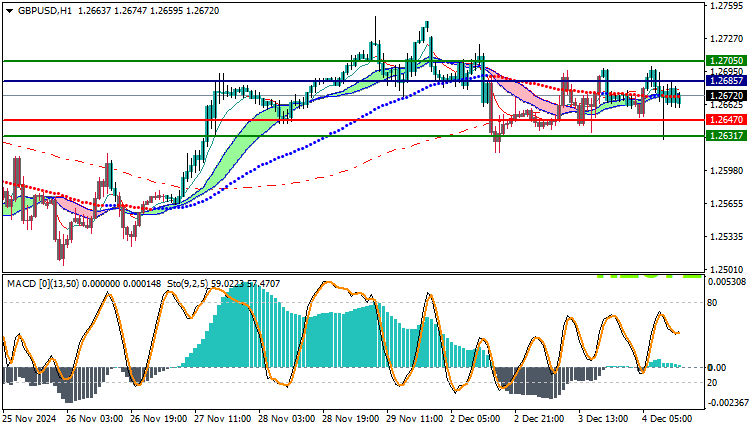
GBPUSD Technical Analysis: The GBP/USD pair appears today in a weak uptrend, as the pair recorded its highest price during the session at 1.2699, then declined to reach a low at 1.2627, before currently settling at 1.2672. This movement reflects limited upward attempts, but the purchasing power remains weak, indicating weak momentum in the upward trend.
GBPUSD Technical Analysis: Analysis of Trading Prices
Current prices are trading below the main moving averages, which weakens the chances of continuing the upward trend. The pair’s inability to maintain the 1.2699 level indicates a decline in the purchasing momentum, which increases the possibility of the price falling towards lower support levels. Trading prices near these weak levels reinforces expectations of a possible downward correction in the near term. Technical analysis using technical indicators:
- Moving averages: The pair is trading below the moving averages, which shows weak purchasing power, as the pair still needs to break the moving average levels to be able to confirm the bullish trend more strongly. Continued trading below these averages indicates an increasing possibility of a decline.
- MACD indicator: Although the MACD indicator shows weak positive signals, the intersection between the MACD line and the signal line reflects a weak bullish trend. The narrow distance between the two lines indicates that the bullish momentum is not strong, which increases the possibility of an imminent decline. In the event of a bearish intersection, this may indicate a change in the trend to a bearish one.
Future outlook:
The bullish momentum in the GBP/USD pair remains weak, and considering the pair trading below the moving averages indicates the difficulty of continuing the bullish trend. In the event that the pair breaks the support level at 1.2627.
this may enhance the chances of a decline towards lower levels such as 1.2600 or 1.2550. On the other hand, any attempt to rise towards 1.2700 may face strong resistance, especially at the moving averages that act as strong resistance levels.
Trading strategies based on Buy/Sell levels
| GBPUSD | In case of buying | in case of selling |
| Entry point | 1.2685 | 1.2647 |
| Target Point 1 (TP1) | First resistance: 1.2705 | First support: 1.2631 |
| Target Point 2 (TP2) | Second resistance: 1.2725 | Second support : 1.2621 |
| Stop Loss (SL) | 1.2647 | 1.2685 |
Trading below the moving averages and a weak MACD indicates that the uptrend in GBP/USD remains fragile and lacking momentum. Under these conditions, the chances of a bearish pullback in the short term are increasing, especially if the current support level at 1.2627 is broken. It is important to follow the price action around these levels to determine whether the pair will continue to decline or retest the rising resistance levels.


