
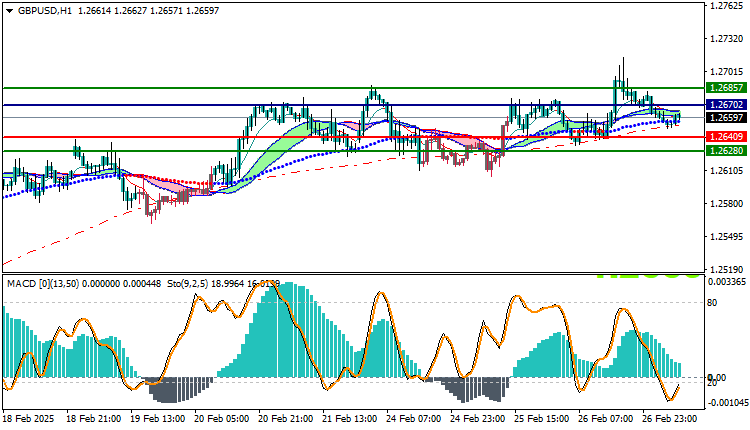
GBPUSD Technical Analysis: The GBP/USD pair continues today’s trading within a weak upward trend, as the pair recorded its highest price so far at 1.26788, while its lowest level reached 1.26470. At the moment, the pair is trading at the level of 1.26597, indicating limited trading within a narrow range.
GBPUSD Technical Analysis: Technical analysis
Through technical analysis, we find that the pair is trading below the main moving averages levels at the beginning of the session, which reduces the possibility of a strong rise continuing. Trading prices below the moving averages reflects the lack of strong momentum in the upward trend, and indicates hesitation in price movement.
On the other hand, the MACD indicator is showing positive signals, but it remains weak at the moment, as it does not reflect sufficient strength to support the upward trend continuously. The bullish divergence in the indicator suggests a limited opportunity to rise, but these signals need greater confirmation in the event of decisive breaches of resistance levels.
Market Outlook:
The uptrend is expected to remain weak unless the pair makes a clear breakout of 1.26702, as trading below the moving averages reduces the chances of a strong continuation of the rise. If the pair fails to complete the rise, we may see a correction towards the nearest support levels, such as 1.26409.
Trading strategies based on Buy/Sell levels
| GBPUSD | In case of buying | in case of selling |
| Entry point | 1.26702 | 1.26409 |
| Target Point 1 (TP1) | First resistance: 1.26857 | First support: 1.26280 |
| Target Point 2 (TP2) | Second resistance: 1.27105 | Second support : 1.26140 |
| Stop Loss (SL) | 1.26409 | 1.26702 |
The GBP/USD pair appears to be trading in a weak uptrend at the moment. Despite the positive signals from the MACD, trading below the moving averages indicates weak upward momentum. It is important to follow technical developments closely, as any break of key levels could change the market’s direction.


