
GBPUSD Technical Analysis: The GBP/USD pair is trading today in an upward trend, as it was able to achieve its highest trading price so far at 1.2764, while recording its lowest price at 1.2733. At the moment, the pair is trading at the level of 1.2748, indicating relative stability in prices near this point.
GBPUSD Technical Analysis: General trend analysis
The pair is showing an upward trend throughout the day, but there is a noticeable weakness in the strength of this trend. Prices are currently trading near support levels and below some moving averages, indicating that the upward momentum may face some challenges. The weakness of the upward trend is evident in the price action that was unable to break through some important technical barriers.
Technical analysis:
Moving averages:
Prices are trading at the beginning of the day below some moving averages, indicating a weakness in the strength of the upward trend. Although the pair is in an uptrend in the short term, prices have failed to hold above the key moving averages, indicating that the uptrend may not be strong enough to continue.
MACD Analysis:
The MACD is indicating a positive trend, as its values are above the zero line, indicating some strength in the bullish momentum. However, there is weakness in this positive trend.
as the divergence between the MACD line and the signal line is very small, reflecting weakness in the current bullish momentum. This suggests that the uptrend may be unsustainable if the momentum continues to decline.
Trading Expectations:
Given the weakness in the uptrend, we may see sideways movements or price fluctuations in the short term. The pair may test the nearby support level at 1.2733, and if broken, the pair may head towards lower levels such as 1.2700. On the other hand, if the bullish momentum continues despite its weakness.
we may see an attempt to break the 1.2764 level, but the possibility of continuing the rise may be limited.
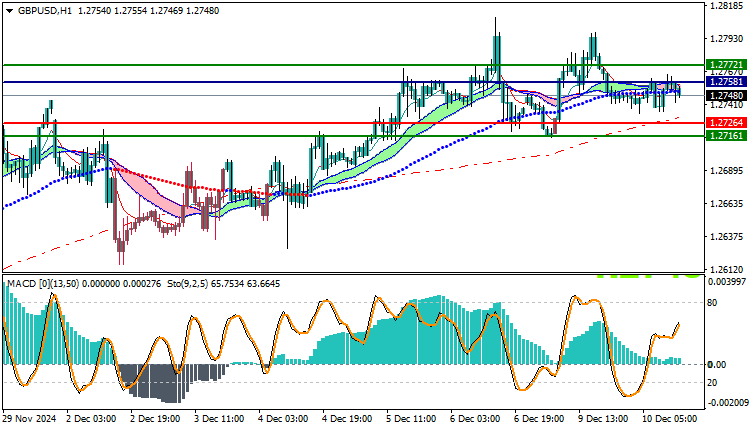
Trading strategies based on Buy/Sell levels
| GBPUSD | In case of buying | in case of selling |
| Entry point | 1.2758 | 1.2726 |
| Target Point 1 (TP1) | First resistance: 1.2772 | First support: 1.2716 |
| Target Point 2 (TP2) | Second resistance: 1.2793 | Second support : 1.2706 |
| Stop Loss (SL) | 1.2726 | 1.2758 |
The GBP/USD pair is trading in an uptrend, but there is a clear weakness in the trend. Although the MACD indicator is indicating a positive trend.
the weakness in the momentum may lead to price volatility or even a downward correction in the short term. It is recommended to monitor the nearby support levels at 1.2733 and the resistance level at 1.2764 to determine the pair’s path in the coming days.


