
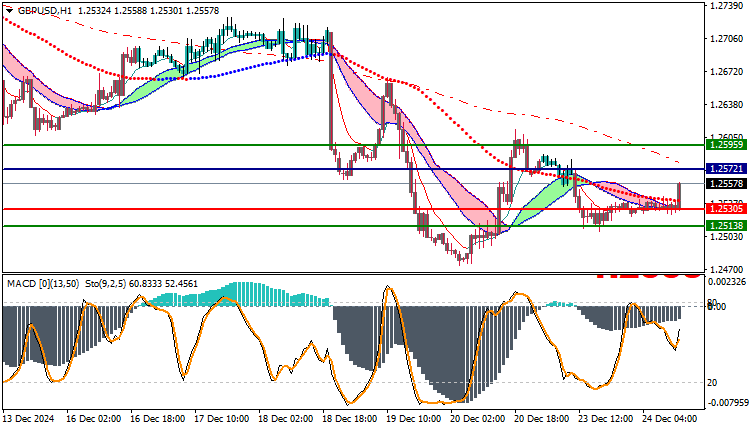
GBPUSD Technical Analysis: The GBP/USD pair is witnessing weak bearish trading today, as the pair recorded its highest price so far at 1.2560, while it recorded its lowest price at 1.2523. It is currently trading at 1.2557, reflecting a state of relative stability near these levels. Technical analysis shows that prices are trading above the moving averages indicators, which enhances potential upward opportunities and significantly reduces the chances of decline.
GBPUSD Technical Analysis: Technical analysis
By analyzing the moving averages, we notice that prices are moving above the short-term and long-term moving averages, which indicates the presence of potential support in the event of downward corrections. This shows that the downward trend is very weak, with no strong confirmation of the continuation of the negative movement. The presence of prices above the moving averages enhances the chances of returning to the uptrend in the short term.
MACD indicator:
MACD indicator shows a negative trend, but reflects weakness in the downward momentum, as the indicator is still in a slowdown state. This negative signal comes with a weakness in the overall trend, indicating that the downtrend is not strong enough to push prices to new lows. This signal could serve as a warning to traders that there is weakness in the current price momentum.
Today’s Trading Outlook:
Given the current situation, the pair is expected to remain in a weak bearish trading range in the short term, with a possibility of an upward correction if trading is maintained above the moving averages. If the pair continues to consolidate above the 1.2530 level, it could see an upward move towards nearby resistance levels at 1.2580. A break of 1.2520 could see the pair head towards testing weaker support levels.
Trading strategies based on Buy/Sell levels
| GBPUSD | In case of buying | in case of selling |
| Entry point | 1.2572 | 1.2530 |
| Target Point 1 (TP1) | First resistance: 1.2595 | First support: 1.2513 |
| Target Point 2 (TP2) | Second resistance: 1.2620 | Second support : 1.2500 |
| Stop Loss (SL) | 1.2530 | 1.2572 |
Technical analysis suggests that the GBP/USD pair is witnessing a weakening downtrend, with prices trading above the moving averages.
which enhances the chances of an upside move. At the same time, the MACD indicator indicates a weakening downside momentum, which reduces the chances of a continued significant decline. The overall trend remains weak, with chances of a short-term upside move if prices hold above key support levels.


