
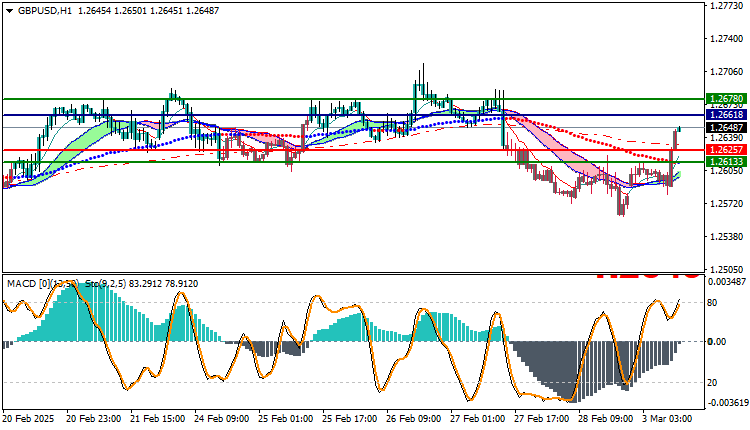
GBPUSD Technical Analysis: Today, the GBP/USD pair is witnessing trading movements within a weak range in the downward direction. The pair recorded its highest level so far at 1.26487, while its lowest price reached 1.25800. At the moment, the pair is trading near the 1.26487 level, reflecting a limited sideways movement. Prices remain moving above the moving averages indicators, indicating the presence of support in the short-term upward trend, although the upward force seems weak at the moment.
GBPUSD Technical Analysis: Technical analysis
- Price analysis: The price of the pair is currently reflecting movements within a narrow range, with prices centered in the area above the moving averages, which reinforces expectations of a limited continuation of the upward trend.
- Technical analysis indicators: The MACD indicator indicates a negative trend but with weak intensity, reflecting the market volatility at the moment. Despite this negative signal, the upward forces remain in place due to the prices moving above the moving averages.
Trading Outlook:
The GBP/USD pair is expected to continue to fluctuate in a narrow range during the coming hours, especially in light of the current weak trends. In case of continued movements above the moving averages, we may witness an attempt to test higher resistance levels, which may lead to pushing prices towards 1.26618 or even 1.26780 in case of a strong push from the bullish momentum.
Trading strategies based on Buy/Sell levels
| GBPUSD | In case of buying | in case of selling |
| Entry point | 1.26618 | 1.26257 |
| Target Point 1 (TP1) | First resistance: 1.26780 | First support: 1.26133 |
| Target Point 2 (TP2) | Second resistance: 1.26920 | Second support : 1.16033 |
| Stop Loss (SL) | 1.26257 | 1.26618 |
The current trading of the GBP/USD pair remains volatile with a slight upward bias, however, the MACD signals remain inconclusive, which requires close monitoring of the upcoming moves. Investors should closely monitor key support and resistance levels, taking into account that the market may witness further weakness in trends if the current volatility persists.


