
GBPUSD Technical Analysis: The GBP/USD pair is showing bearish trading today, but there is a noticeable weakness in the bearish momentum. The pair recorded a high price for the day so far at 1.24688 and a low price at 1.24154, and it is currently trading at the level of 1.24462, reflecting a state of volatility within a relatively narrow range.
GBPUSD Technical Analysis: Price analysis
Despite the bearish trend that currently dominates the pair, the price is showing trading above some moving average indicators. This indicates a clear weakness in the momentum of the downtrend, as prices are supposed to move below these averages if there is a continuous bearish force in the market. Trading the price above these levels reinforces the idea that there is resistance to continue the current downtrend.
Technical Analysis
Moving Averages: The pair is currently trading above some moving averages, indicating that the downward momentum is weakening, and therefore the pair may be in a correction phase or sideways movement. Moving averages are usually an important indicator to determine the general direction of the market, and in this case, the price being above the moving averages reflects a relative balance between selling pressure and buying demand.
MACD Analysis: The MACD indicator indicates a negative trend, but it also shows a weakness in the downward momentum. Despite the negative signal, the downward momentum is not strong enough to push the price in a strong downward direction. This may be an indication that the market is in a correction or oscillation phase, and that the downward trend is facing resistance.
Trading Expectations:
With the price trading above the moving averages and the MACD indicator showing a weak negative signal, the pair is expected to continue moving in a narrow range or perhaps witness some oscillation. The market may witness a new attempt to rise if it finds support from the current price levels, or the price may return to decline if it breaks the support levels.
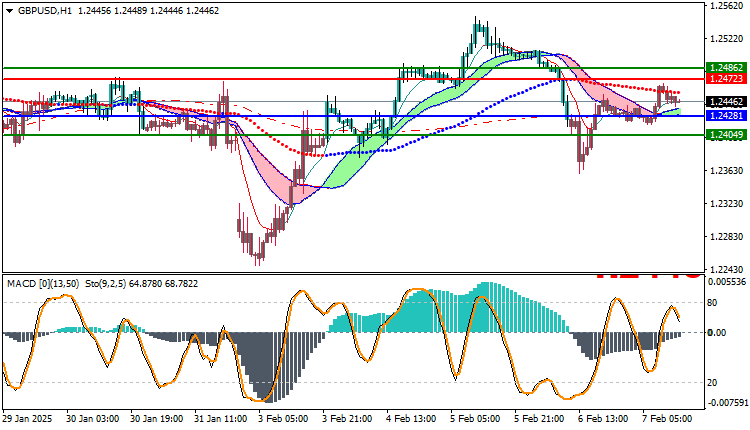
Trading strategies based on Buy/Sell levels
| GBPUSD | In case of buying | in case of selling |
| Entry point | 1.24723 | 1.24281 |
| Target Point 1 (TP1) | First resistance: 1.24490 | First support: 1.24049 |
| Target Point 2 (TP2) | Second resistance: 1.24921 | Second support : 1.23800 |
| Stop Loss (SL) | 1.24281 | 1.24723 |
Although the overall trend for GBP/USD is bearish, there is a noticeable weakening of the downward momentum as the price is trading above some moving averages. The MACD indicator adds to this analysis, indicating a decline in negative strength. The pair may see a sideways movement or temporary correction before the main market trend is determined. Traders should follow key technical levels and look for additional signals to confirm the upcoming trend.


