
GBPUSD Technical Analysis
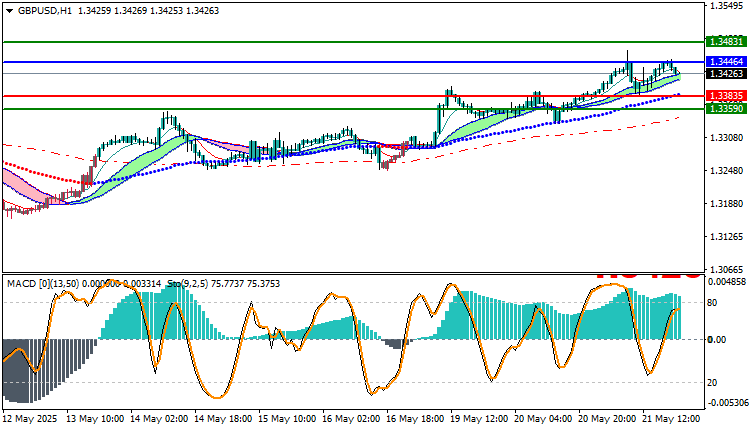
The GBP/USD currency pair is currently exhibiting a clear upward trend, supported by key technical indicators. At present, the pair is trading at 1.34263, demonstrating strength above several major moving average crossovers. This positioning suggests sustained bullish momentum, indicating that buyers continue to dominate the market.
Further confirmation of this positive trend comes from the MACD (Moving Average Convergence Divergence) indicator, which is currently signaling upward momentum. The MACD line is positioned above the signal line, and the histogram bars reflect strengthening buying pressure. These signals reinforce the overall bullish sentiment surrounding the GBP/USD pair.
Given the prevailing trend, a buying opportunity is present as the price climbs toward the 1.34464 level. This area may serve as an ideal entry point, supported by technical strength and the overall market sentiment. Traders could then aim for a target at 1.34831, where potential resistance may arise, offering a reasonable risk-to-reward ratio for short- to medium-term strategies.
To manage downside risk effectively, it is advisable to place a stop-loss at 1.33835. This level lies below recent support and could protect against unexpected reversals or broader market corrections. The placement of this stop-loss allows traders to remain in the trade as long as the uptrend remains intact, while minimizing potential losses if the market shifts direction.
Overall, technical indicators currently favor a bullish outlook for GBP/USD. The pair’s position above key moving averages, combined with a supportive MACD reading, suggests continued upward momentum. Traders may consider taking long positions near the suggested entry point, while maintaining appropriate risk management practices to navigate potential volatility.
GBPUSD Technical Analysis: On the Other Hand
if the sell zone at $1.33835 is broken, the GBP/USD price may head towards $1.33590.
Resistance and Support Levels
- Second Resistance: 1.34362
- First Resistance: 1.34315
- Pivot Level: 1.34230
- First Support: 1.34180
- Second Support: 1.34107


