
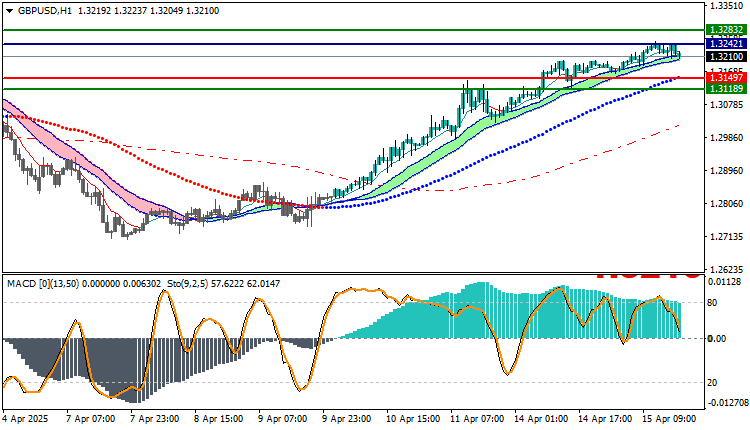
GBPUSD Technical Analysis: The GBP/USD currency pair is currently exhibiting strong bullish momentum, signaling a continued upward trend in the near term. At present, the pair is trading around the 1.32100 level, maintaining its position above several key moving average crossovers. This alignment supports the ongoing strength in the pair and highlights the market’s preference for buying the dips.
From a technical standpoint, the MACD (Moving Average Convergence Divergence) indicator is also reinforcing the bullish outlook. With the MACD line remaining above the signal line and showing sustained positive histogram bars, momentum appears to favor buyers. These indicators collectively suggest that the GBP/USD pair may continue its upward trajectory, offering potential opportunities for traders looking to capitalize on the trend.
Given this favorable setup, a buy position could be considered as the price moves toward the next resistance level around 1.32421. If bullish pressure persists, the pair could aim for a further target near the 1.32832 mark, representing a solid continuation of the current uptrend.
However, prudent risk management remains essential. In case of any reversal or unexpected volatility, the 1.31497 level is recommended as a suitable stop-loss point. This support zone has previously acted as a price floor and offers a logical area to manage downside risk.
Overall, the technical indicators and price action suggest a continuation of the upward trend for GBP/USD, presenting a favorable setup for bullish trades in the short term. Traders should watch key resistance and support levels closely while aligning strategies with ongoing market momentum.
GBPUSD Technical Analysis: On the Other Hand
if the sell zone at $1.31497 is broken, the GBP/USD price may head towards $1.31189.
GBPUSD Technical Analysis: Resistance and Support Levels
- Second Resistance: 1.32389
- First Resistance: 1.32283
- Pivot Level: 1.32100
- First Support: 1.32003
- Second Support: 1.31826


