
GBPUSD Technical Analysis
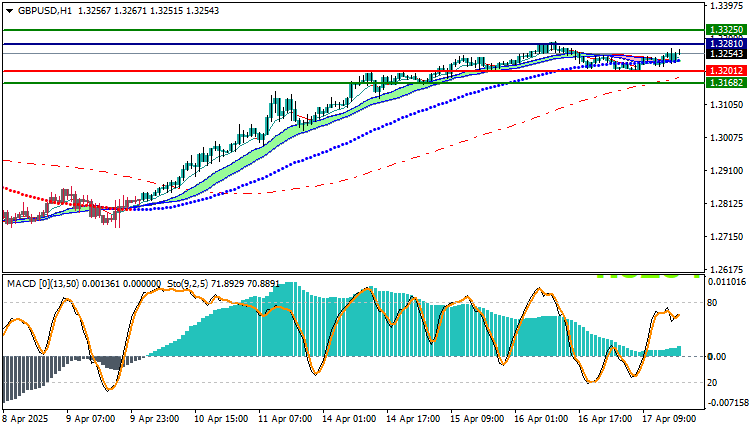
The British Pound continues to show strength against the US Dollar, with the GBP/USD pair currently trading around the 1.32543 level. Recent price action highlights a clear upward trend, supported by bullish signals from key technical indicators.
One of the most prominent signs of continued bullish momentum is the pair’s position above several major moving average crossovers. This indicates strong buying interest and suggests that the market sentiment remains in favor of the bulls. Additionally, the Moving Average Convergence Divergence (MACD) indicator is showing a positive signal, with the MACD line trading above the signal line, further reinforcing the upward bias.
Given this technical setup, a short-term buying opportunity is being considered. A potential entry point for long positions lies around 1.32810, which aligns with the current trend and shows room for further upside movement. If the bullish momentum sustains, the next key resistance to watch is around 1.33250, which can be targeted as a short-term profit level.
However, to effectively manage risk, it is prudent to implement a stop-loss order. The 1.32012 level serves as a logical support zone and is recommended as a stop-loss point. This level lies just below recent price consolidation and provides a reasonable buffer against unexpected pullbacks while keeping the risk-to-reward ratio favorable.
Overall, the current technical outlook for GBP/USD remains bullish, supported by trend analysis and momentum indicators. Traders looking to capitalize on the continued upward movement may consider entering long positions on slight pullbacks or breakouts.
with a well-placed stop to limit downside exposure.
GBPUSD Technical Analysis: On the Other Hand
, if the sell zone at $1.32012 is broken, the GBP/USD price may head towards $1.31682.
GBPUSD Technical Analysis: Resistance and Support Levels
- Second Resistance: 1.32762
- First Resistance: 1.32606
- Pivot Level: 1.32433
- First Support: 1.32273
• Second Support: 1.32100


